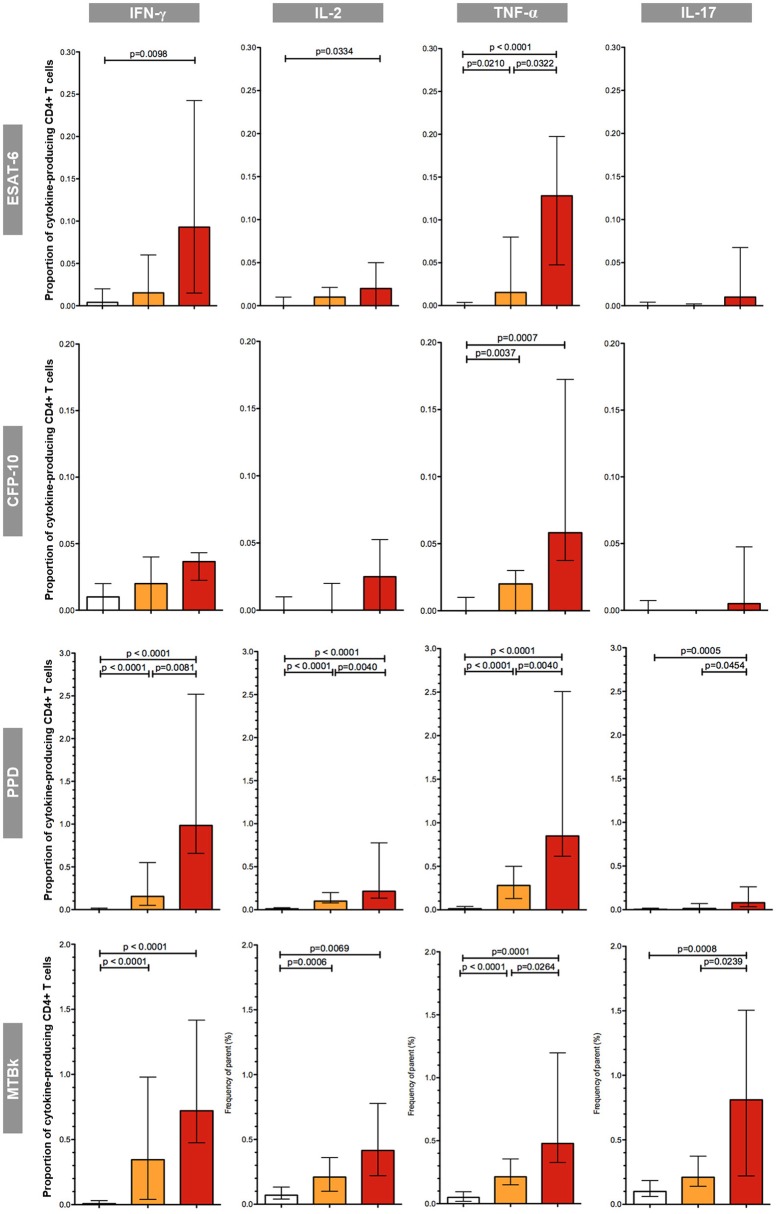
Figure 3.
Proportions of mycobacteria-specific, cytokine-producing CD4+ T cells induced by antigenic stimulation in the three diagnostic groups. The different groups are indicated by the color: uninfected (white boxes), latent tuberculosis infection (orange boxes), active tuberculosis (red boxes). The respective antigenic stimulant is indicated on the left (note scales vary between stimulants), and the cytokines on the top of the figure. The boxes represent the medians; the whiskers indicate the IQR. All data shown are background-corrected. P-values were calculated with Mann-Whitney U-tests; all significant p-values are shown in the figure.

