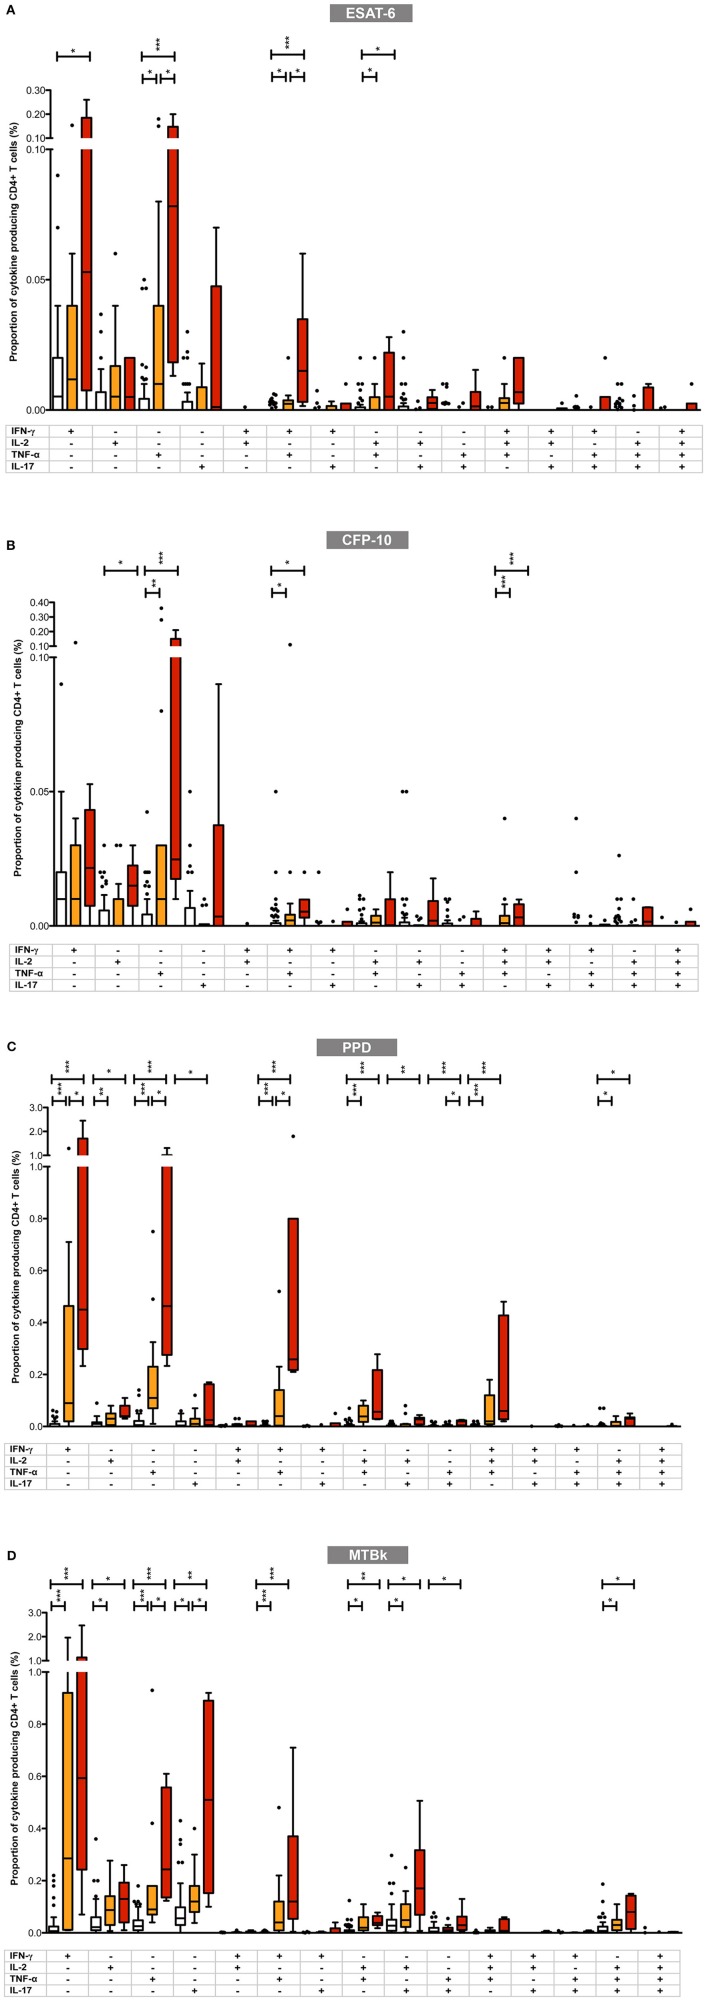
Figure 4.
Proportions of mycobacteria-specific mono- and polyfunctional CD4+ T cells in the three diagnostic groups in (A) ESAT-6, (B) CFP-10, (C) PPD, and (D) MTBk stimulated samples. Box plot with Tukey whiskers; the boxes represent the interquartile range and the horizontal lines indicate the medians. The different groups are indicated by the color: uninfected (white boxes), latent tuberculosis infection (orange boxes), active tuberculosis (red boxes). All possible combinations of cytokine expression are shown on the x-axis (single cytokine producing CD4+ T cells toward the left; polyfunctional CD4+ T cells toward the right). All data shown are background-corrected. Statistically significant differences between the three diagnostic groups are indicated by star symbols: *p < 0.05; **p < 0.001; ***p < 0.0001.

