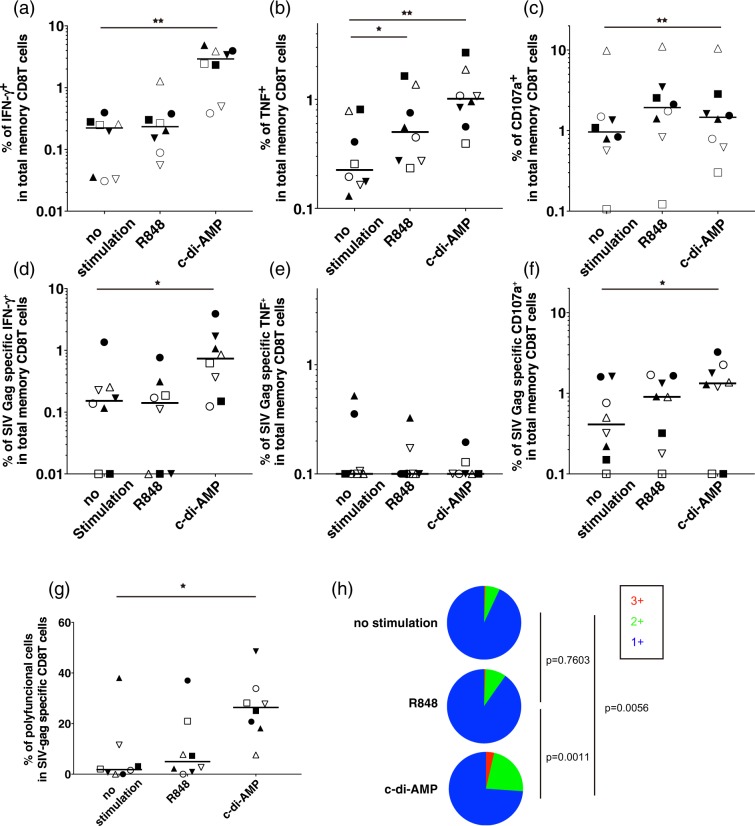
Figure 5.
The effect of c-di-AMP and R848 on CTL responses as analysed by multicolour flow cytometry. (a–c) Percentages of IFN-γ+ (or TNF+, CD107a+) CD8+ T cells in the total memory CD8+ T cell population are plotted. (d,f) Percentages of SIV Gag-specific IFN-γ+ (or TNF+, CD107a+) CD8+ T cells among total memory CD8+ T cells. (g) Ratio of polyfunctional cells in SIV Gag-specific CD8+ T cells. Statistical significances were indicated by stars based on p-values (*P < 0.05, **P < 0.01). Horizontal bars indicate median levels. (h) The pie charts show the fraction of cells with one, two, and three functions. Statistical significances were indicated by permutation p-values.

