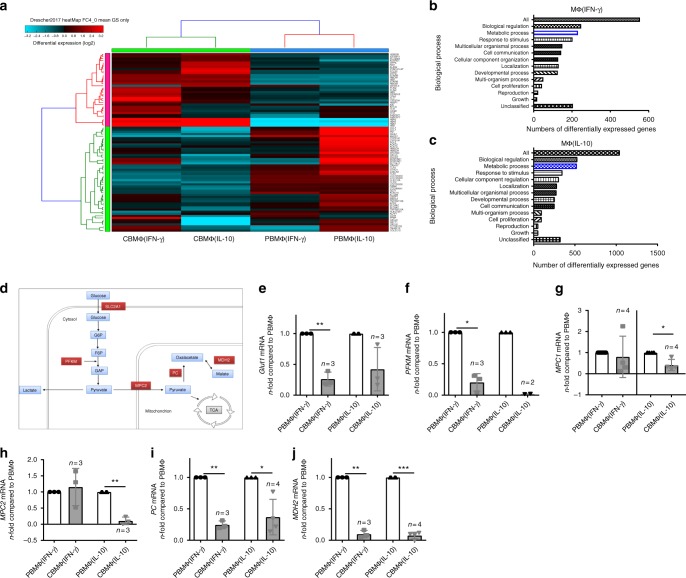
Fig. 2.
Whole-transcriptome analysis reveals broad metabolic aberrations in polarized cord blood macrophages. a Heatmap of differently expressed genes between CBMΦ and PBMΦ after polarization (FC > 4). b, c Enrichment analysis for the top enrichment GO terms from the biological process is shown for MΦ(IFN-γ) (b) and for MΦ(IL-10) (c), metabolic processes are highlighted in blue. d Schematic picture of metabolic enzymes that are downregulated in CBMΦ (in red) in glucose metabolism. e–j N-fold mRNA expression of metabolic enzymes in CBMΦ(IFN-γ) and CBMΦ(IL-10) compared with means of PBMΦ(IFN-γ) and PBMΦ(IL-10) analyzed by RT-qPCR. e Glut1 mRNA expression was measured in n = 3 PBMΦ(IFN-γ), 3 CBMΦ(IFN-γ), 4 PBMΦ(IL-10), and 3 CBMΦ(IL-10) independent samples, **p-value = 0.0078. f PFKM mRNA expression was measured in n = 3 PBMΦ(IFN-γ), 3 CBMΦ(IFN-γ), 3 PBMΦ(IL-10), and 2 CBMΦ(IL-10) independent samples, *p-value = 0.0101. g MPC1 mRNA expression was measured in n = 7 PBMΦ(IFN-γ), 4 CBMΦ(IFN-γ), 6 PBMΦ(IL-10), and 4 CBMΦ(IL-10) independent samples, *p-value = 0.0213. h MPC2 mRNA expression was measured in n = 3 PBMΦ(IFN-γ), 3 CBMΦ(IFN-γ), 4 PBMΦ(IL-10), and 3 CBMΦ(IL-10) independent samples, **p-value = 0.0056. i PC mRNA expression was measured in n = 3 PBMΦ(IFN-γ), 3 CBMΦ(IFN-γ), 3 PBMΦ(IL-10), and 4 CBMΦ(IL-10) independent samples, *p-value = 0.0208 and **p-value = 0.0023. j MDH2 mRNA expression was measured in n = 3 PBMΦ(IFN-γ), 3 CBMΦ(IFN-γ), 4 PBMΦ(IL-10), and 4 CBMΦ(IL-10) independent samples, **p-value = 0.0014 and ***p-value < 0.0001. For (e–j), bars indicate mean and error bars SD, two-tailed, one-sample test

