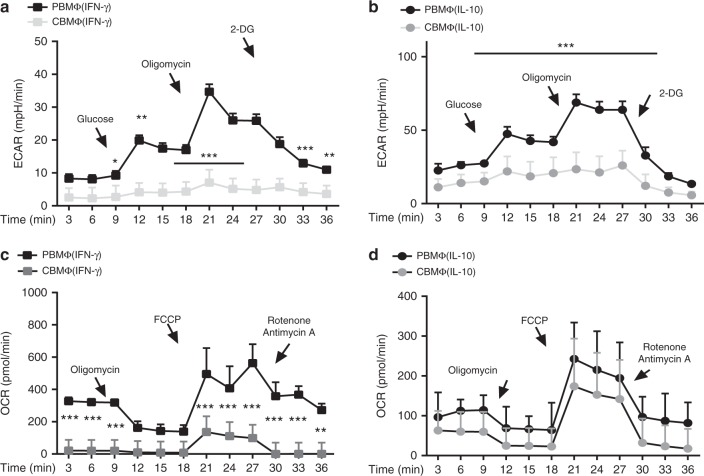
Fig. 3.
Cord-blood macrophages fail to induce glycolysis. ECAR measured under basal conditions and after addition of the indicated drugs in MΦ(IFN-γ) (a) and MΦ(IL-10) (b). Points indicate mean from three independent experiments (error bars represent standard deviation (SD)). OCR measured under basal conditions and after addition of the indicated drugs in MΦ(IFN-γ) (c) and MΦ(IL-10) (d). Points indicate mean from three independent experiments with SD (N = 3–4, heptaplicates *p < 0.05; **p < 0.01; ***p < 0.005, one-way ANOVA, detailed statistics in supplemental informations)

