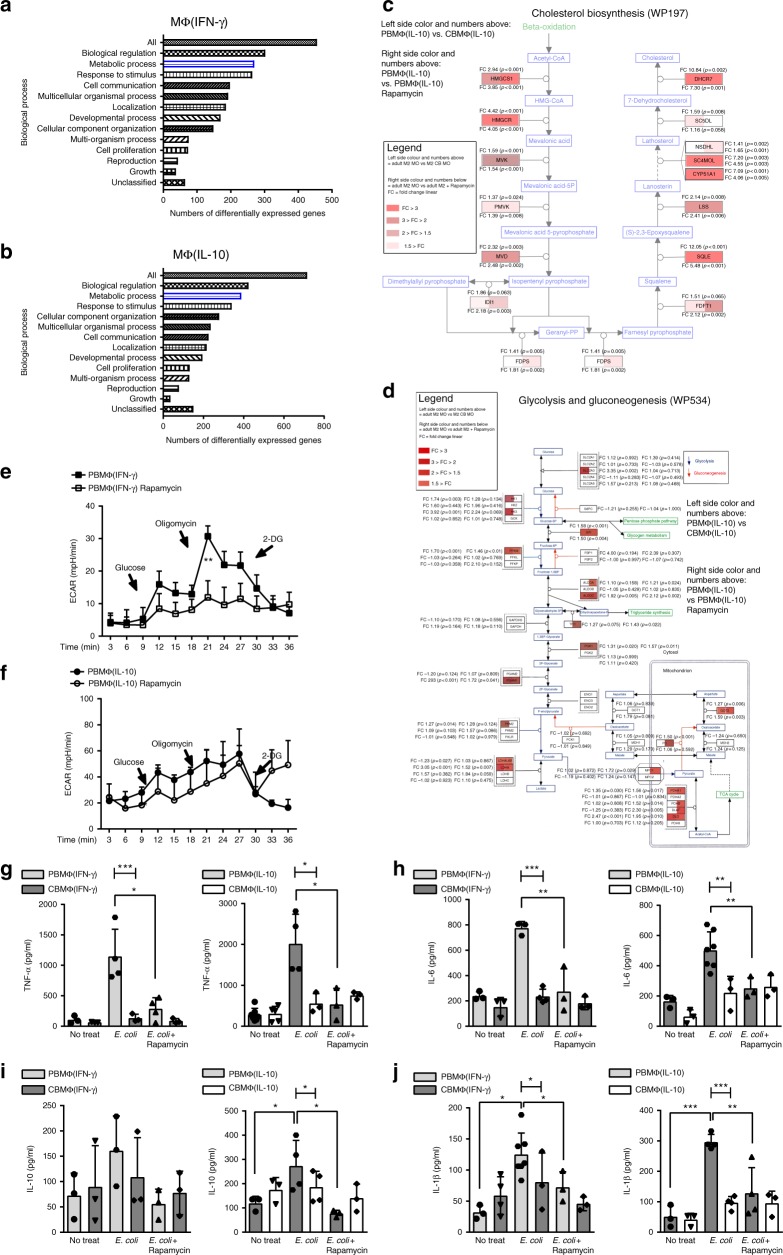
Fig. 5.
mTOR inhibition in adult macrophages partly mimics phenotype and function of cord blood-derived macrophages. a Enrichment analysis for the top enrichment GO terms from the biological process is shown for rapamycin treated vs. untreated MΦ(IFN-γ) b and for rapamycin treated vs. untreated MΦ(IL-10) macrophages (p < 0.05, FC > 2). c Wikipathway analysis of differentially regulated genes within the cholesterol biosynthesis pathway. MΦ(IL-10) macrophages were compared with rapamycin-treated MΦ(IL-10) macrophages and CBMΦ(IL-10) macrophages. d Wikipathway analysis of differentially regulated genes within the glycolysis and gluconeogenesis pathway. MΦ(IL-10) was compared with rapamycin-treated MΦ(IL-10) macrophages and CBMΦ(IL-10). e ECAR measured under basal conditions and after addition of the indicated drugs in M1–MΦ. Points indicate mean from minimal three to four independent experiments (error bars represent SEM). f ECAR measured under basal conditions and after addition of the indicated drugs in M2–MΦ. Points indicate mean from three to four independent experiments (error bars represent SEM, **p < 0.001, one-way ANOVA). g MΦ(IFN-γ) and MΦ(IL-10) were incubated with E. coli + /− Rapamycin. TNF-α levels were measured by ELISA (N = 3–7; *p < 0.05, blunt-ended bars represent one-way ANOVA, ***p < 0.001). h MΦ(IFN-γ) and MΦ(IL-10) were incubated with E. coli + /− Rapamycin. IL-6 levels were measured by ELISA (N = 3–7; **p < 0.01, blunt-ended bars represent one-way ANOVA, **p < 0.01, ***p < 0.001). i MΦ(IFN-γ) and MΦ(IL-10) were incubated with E. coli + /− Rapamycin. IL-10 levels were measured by ELISA (N = 3–4; *p < 0.05, blunt-ended bars represent one-way ANOVA, *p < 0.05). j MΦ(IFN-γ) and MΦ(IL-10) were incubated with E. coli + /− Rapamycin. IL-1β levels were measured by ELISA (N = 3–7; **p < 0.01, ***p < 0.001, blunt-ended bars represent one-way ANOVA, **p < 0.01, ***p < 0.001; for detailed statistics see supplemental information)

