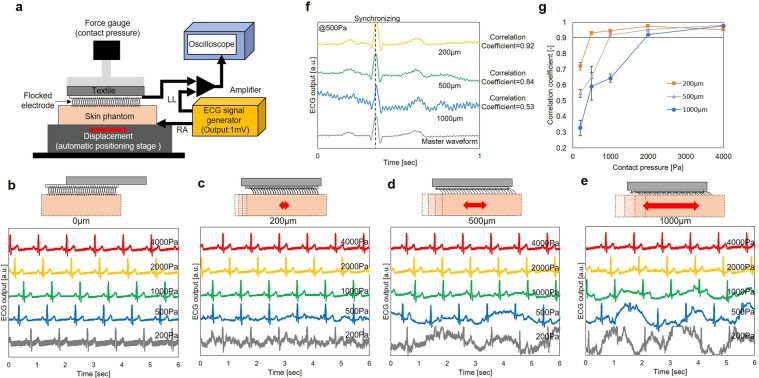
Figure 3.
Evaluation of flocked electrodes using skin phantom. (a) Image of the experimental setup. ECG signals which were inputted by ECG signal generator and measured by using skin phantom when the contact pressure between skin phantom and flocked electrode was 200 Pa, 500 Pa, 1000 Pa, 2000 Pa, and 4000 Pa. The displacement of the skin phantom was (b) 0 µm, (c) 200 µm, (d) 500 µm, and (e) 1000 µm. (f) Example of the calculation result of correlation coefficients with contact pressure of 500 Pa and with displacement of 200 µm, 500 µm, and 1000 µm. (g) Mean value and standard error (five samples) of the correlation coefficient of ECG signals against master waveform when the contact pressure was 200 Pa, 500 Pa, 1000 Pa 2000 Pa, and 4000 Pa.

