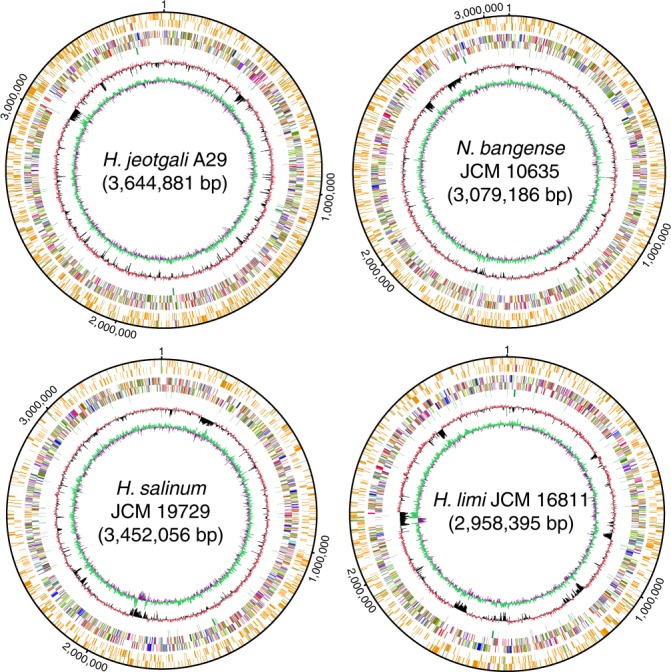
Fig. 2.

Phosphorothioate (PT) mapping across the genomes of H. jeotgali A29, N. bangense JCM 10635, H. salinum JCM 19729 and H. limi JCM 16811. From the outer to the inner circles: circles 1 and 2 (forward and reverse strands), PT sites in ORFs (orange), noncoding RNA (purple), and nonencoding regions (green); circles 3 and 4, predicted protein-coding sequences coloured according to COG functional categories; circle 5, tRNA/rRNA operons; circle 6, guanine-cytosine content; and circle 7, guanine-cytosine skew. Source data are provided as a Source Data file
