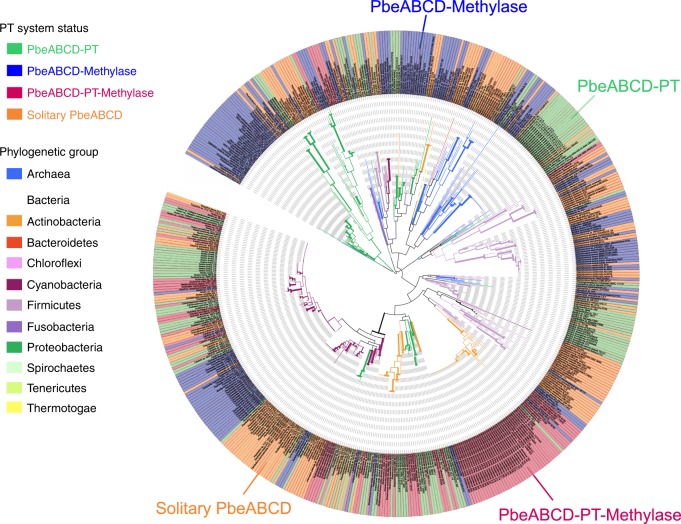
Fig. 6.
Phylogenetic analysis of 553 PbeAC proteins. Each archaeal and bacterial group is represented in a distinct colour. Green (128) and blue (155) shading indicate the presence of DndCD for phosphorothioate (PT) modification or MTase for methylation within the vicinity of PbeAC. One-hundred and five PbeAC homologues have DndCD and MTase simultaneously present within the defined neighbourhood (1 bp–10 kb), while 165 PbeAC homologues are solitary, lacking the modification component within the neighbourhood. Source data are provided as a Source Data file

