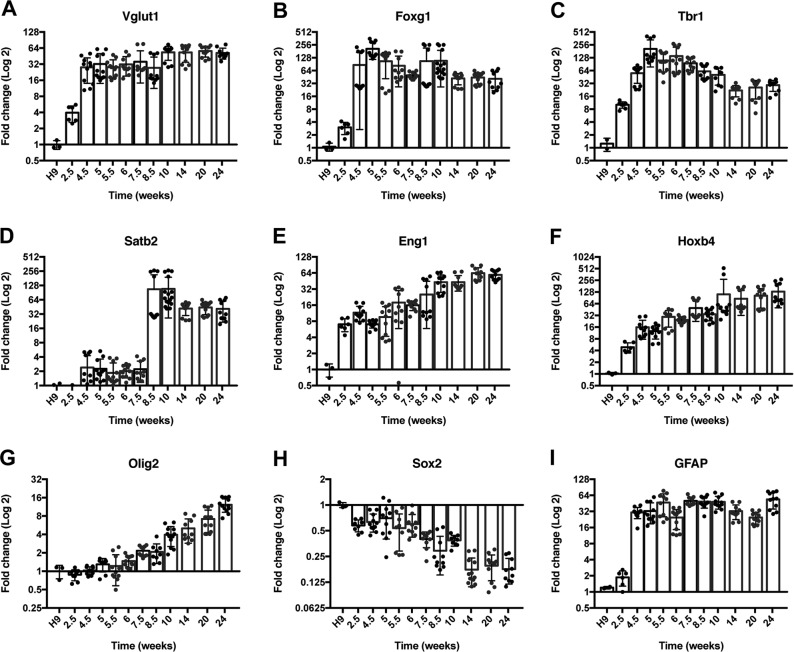
Fig. 3. Time course of expression of key developmental genes.
The glutamate marker Vglut1 (a) was expressed early on and remained highly expressed over the course of 6 months (p < 0.0001). While the expression of the forebrain marker Foxg1 (b) was relatively consistent (p < 0.0001), the expression of cortical layer markers (c, d) changed appropriately with time (Tbr1, p < 0.0001; Satb2, p < 0.0001). The expression of more ventral markers increased over time (e, f) (Eng1, p < 0.0001; Hoxb4, p < 0.001). The oligodendrocyte marker Olig2 (g) increased over time (p < 0.0001). The expression of Sox2 (h) decreased over time (p < 0.0001). The expression of the radial glial/astrocyte marker GFAP (i) had some fluctuations but was relatively consistent over time (p < 0.0001). Fold change was relative to the H9 hESC starting line. For each time point, a minimum of three separate samples were harvested from different batches of cells. Each of these samples were then run in triplicate. Statistical analysis (one-way ANOVA) was performed using Prism software. GAPDH values are in Supplementary Fig. 12A

