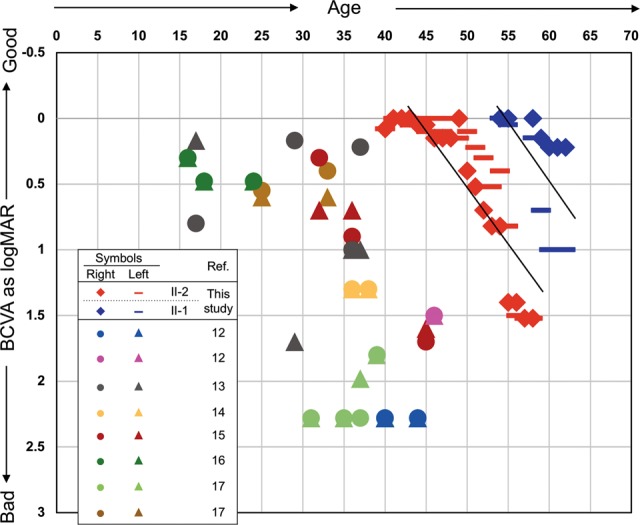
Fig. 2. The best-corrected visual acuity (BCVA) of the patients in this study and the previously reported cases of CRD caused by CDHR1 variants.

The BCVAs (y-axis) of right and left eyes expressed as log values of the minimum angle of resolution (MAR) were plotted with the patient’s age (x-axis) at measurement. For the patients in this study, all of the multiple measurement results for all years were plotted, and linear regression lines were drawn. However, single data points were plotted for previously reported cases because only one value was recorded for most cases. For some exceptional patient cases in which 2 or more data points at different ages were described12, the data of the worst BCVA was used here. Cases without the BCVA data were excluded from this graph18. The symbols for each of the cases are indicated in the inset table. Multiple points with the same symbol indicate different patients from the same family
