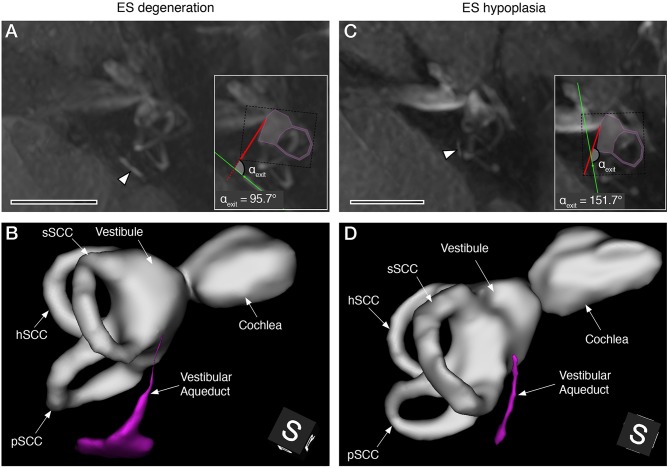
Figure 3.
Gd-MRI VA morphology in representative MD cases with degenerative (A,B) and hypoplastic (C,D) ES pathology. Maximum intensity projections of axial plane images (A,C), and 3D reconstructions (postero-superior view) of the labyrinthine fluid spaces with the VA shown in magenta (B,D). Arrowheads in (A,C) indicate the VA in the opercular region. Insets in (A,C) show angle measurements of the VA's angular trajectory as described previously (7) (sSCC, superior semicircular canal; hSCC, lateral semicircular canal; pSCC, posterior semicircular canal). Scale bars, 10 mm.

