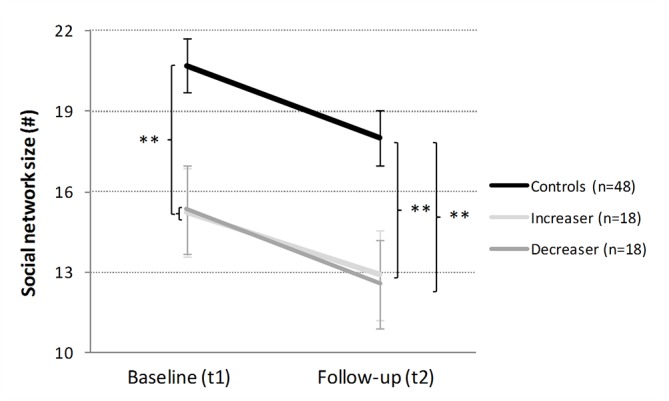
Figure 4.

Development of social network size in cocaine increasers, decreasers, and stimulant-naive controls within 1 year. Mean total network size and standard errors. At baseline, controls vs CCU (= Ø of increaser and decreaser). Independent Student’s t-tests are shown if p < .10. **p < .01.
