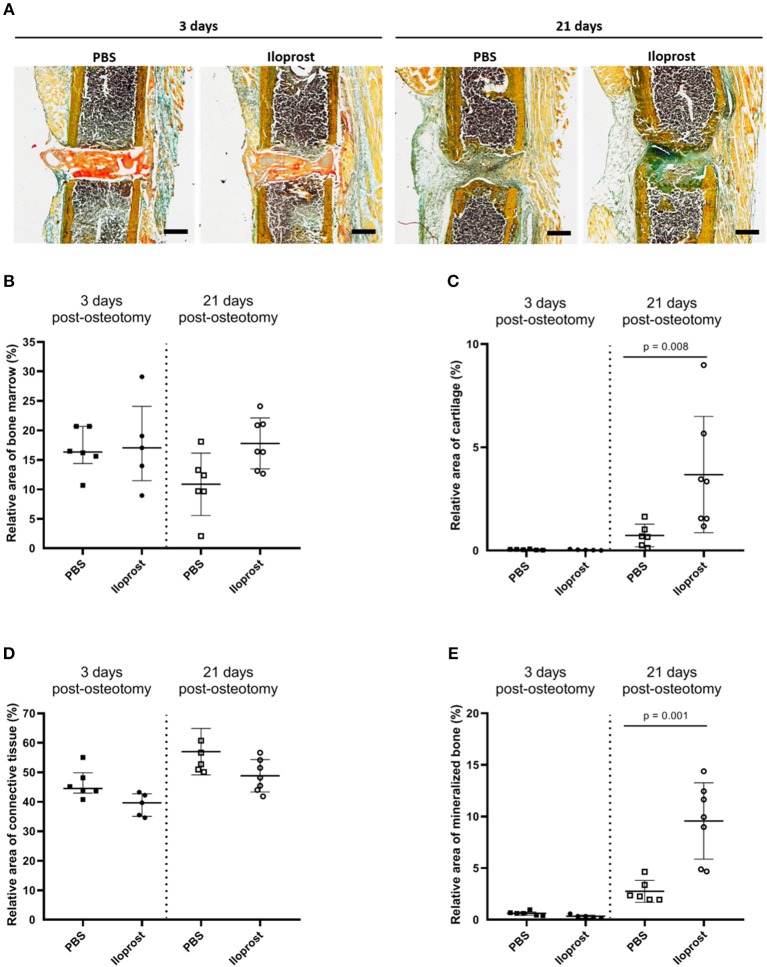
Figure 10.
Histological analysis of in vivo experiments in mouse osteotomies at days 3 and 21 post-osteotomy. (A) Representative Movat's pentachrome pictures are displayed for the respective time point and group. (B–E) Histomorphometrical analysis of the Movat Pentachrome stainings: (B) bone marrow, (C) cartilage tissue, (D) connective tissue, and (E) mineralized bone tissue. Color coding of the Movat Pentachrome staining: mineralized bone = yellow, cartilage = dark blue-green, connective tissue = light blue-green, muscle fibers = light orange, cell nuclei = purple, fibrin clot = red/orange. Scale bars equal 500 μm, n = 6.

