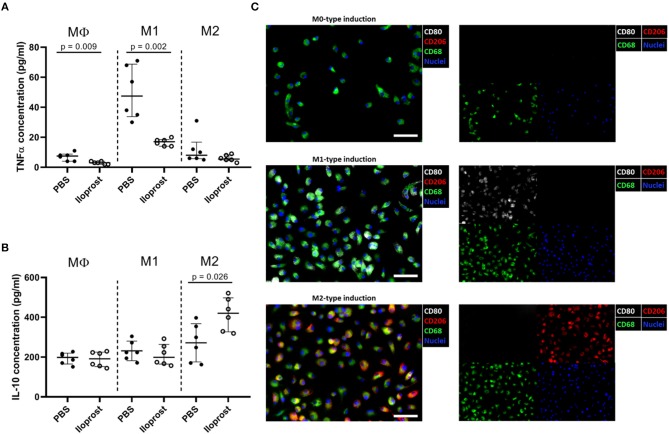
Figure 4.
Immunomodulatory effects of Iloprost on polarized bone marrow macrophages. Macrophages were polarized for 3 days toward the M1 or M2 type, supplemented with either PBS or 3 μM Iloprost. (A,B) The following secreted cytokine concentrations were evaluated: TNFα (A) and IL-10 (B) of M1-type induced and M2-type induced polarized macrophages, respectively. (C) Representative immune fluorescence images of unpolarised CD68+ MΦ macrophages (on top), CD68+CD80+ M1 macrophages (middle), and CD68+CD206+ M2 macrophages (bottom). Color code of the immune fluorescence images: CD68 = green, CD80 = white, CD206 = red, and cell nuclei = blue (DAPI). Scale bars: 100 μm; n = 6.

