Figure 3.
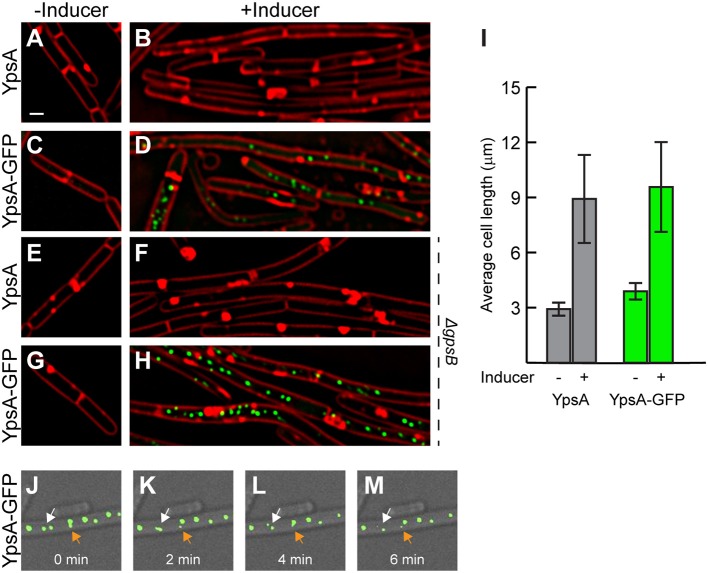
Elevated production of YpsA or YpsA-GFP leads to inhibition of cell division. (A–D) Morphology of cells containing inducible ypsA (GG82) or ypsA-gfp (GG83) grown in the absence of inducer IPTG (A,C) or in the presence of inducer for 1 h (B,D). (E–H) Cell morphology of strains lacking gpsB and containing either inducible ypsA (RB43) or ypsA-gfp (RB44) grown in the absence (E,G) or presence (F,H) of inducer. (I) Quantification of cell lengths of cells shown in (A–D). Time-lapse micrographs of ypsA-gfp expressing cells (GG83) at time intervals indicated at the bottom. White and orange arrows follows different foci that are mobile. DIC (gray) and fluorescence of membrane dye (FM4-64; red), GFP (green) are shown. Scale bar: 1 μm.

