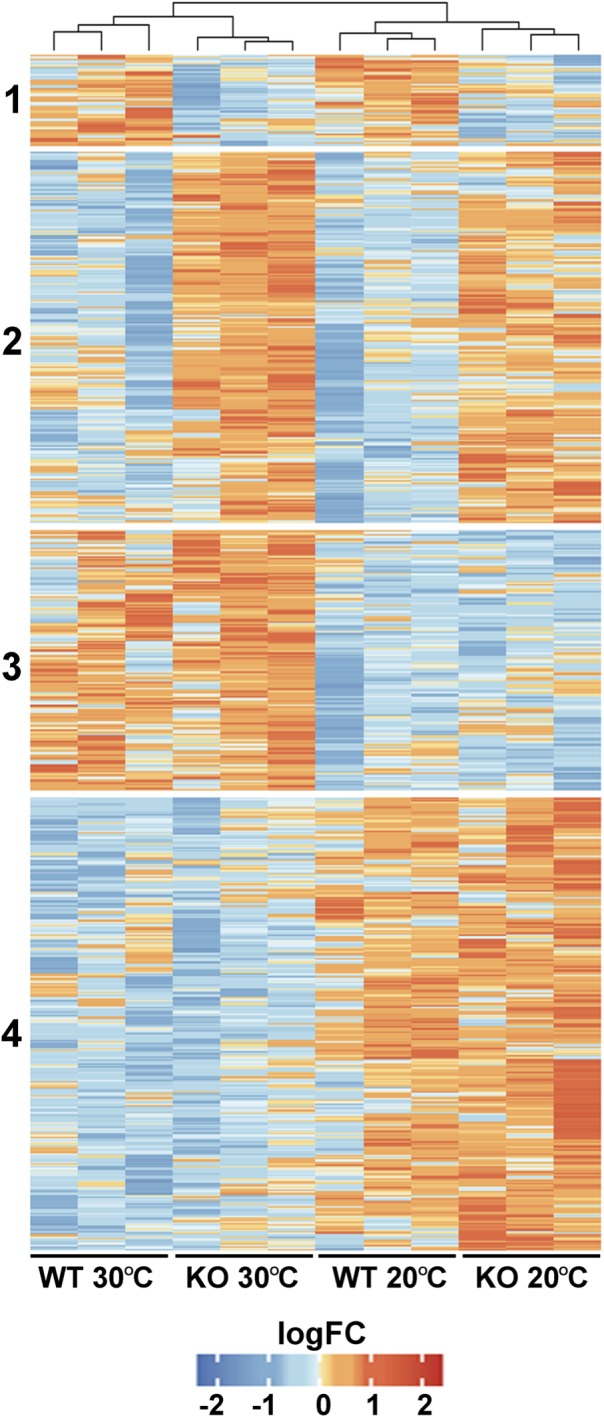
FIGURE 5.

Comparative proteomic analysis of WT and FTSH11 KO mutant. WT and mutant plants were grown at 20°C for 4 weeks and then either exposed or not to 30°C for 6 h. Total protein was extracted from leaves and subjected to label-free quantitative LC-MS/MS analysis. Relative levels of all differentially expressed proteins in the two genotypes and two temperature treatments and their clustering are presented.
