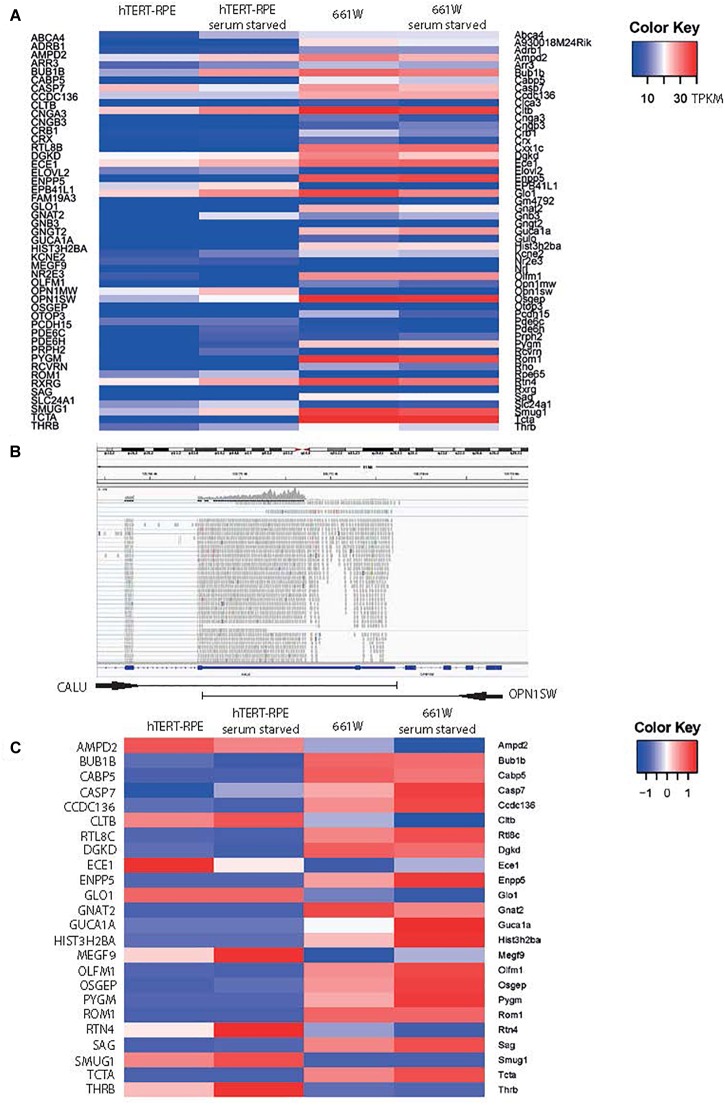
FIGURE 2.
661W cells express markers of photoreceptor fate. (A) Heat map of expression of 48 genes characteristic of cone photoreceptors (Corbo et al., 2007) in hTERT-RPE1 cells and 661W cells in conditions of serum and serum starvation. Scale bar shows intensity of color relative to TPKM. (B) IGV screenshot of OPN1SW genomic location in human genome hg38, with one shared exon with CALU, which accounts for the mapping of reads to OPN1SW in the hTERT-RPE1 cell line. (C) Heat map showing expression level of all cone cell genes expressed in 661W cells, relative to the expression these genes in hTERT-RPE1 cells. Scale bar shows intensity of color relative to scaled expression value from –1 to 1 across each row.

