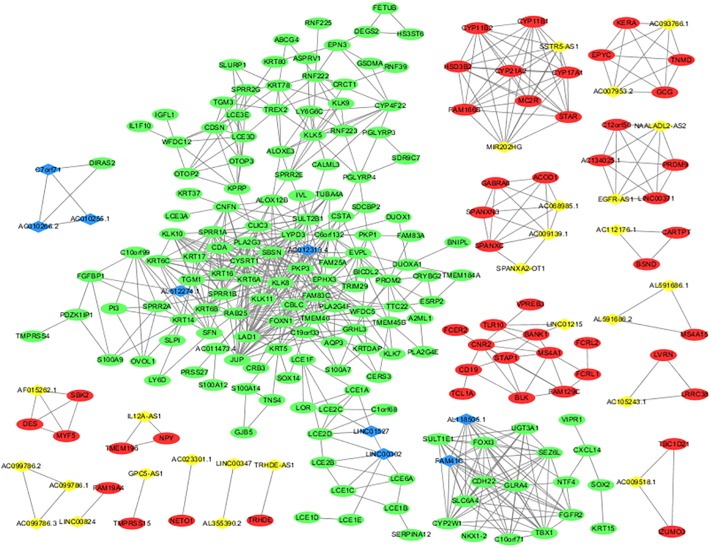
FIGURE 3.
lncRNA and mRNA co-expression network in melanoma. The co-expression network established with 235 nodes and 762 edges, in which only edges with weight(w) above a threshold of 0.8 are displayed. The yellow nodes denote upregulated lncRNAs and the blue nodes denote downregulated lncRNAs. The red nodes denote upregulated mRNAs and the green nodes denote downregulated mRNAs.

