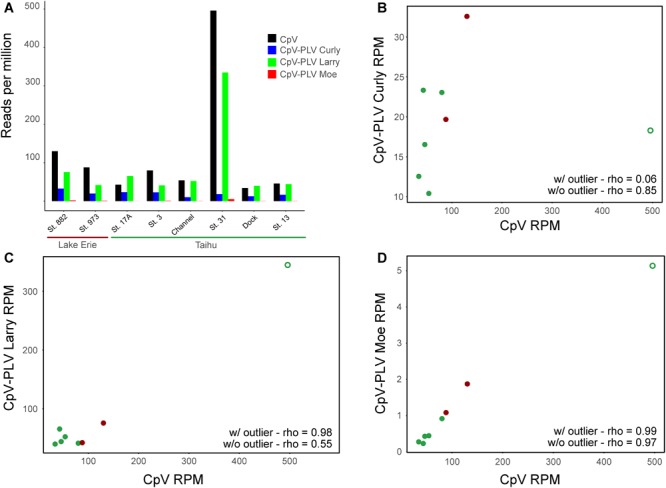
FIGURE 6.

(A) Metatranscriptomic sequencing reads sequenced from the Lake Erie and Lake Tai from 2013 cyanobacterial blooms mapped to CpV-BQ2 and virophage genomes and expressed in reads per million. Spearman’s correlation coefficients (rho) are shown for data including the outlier sample and for data excluding outlier sample for the correlations between reads mapped to CpV-BQ2 and (B) CpV-PLV Curly, (C) CpV-PLV Larry, and (D) CpV-PLV Moe. Points in panels (B–D) are colored red or green to show data points collected from Lake Erie or Tai, respectively, and the outlier data points are denoted with open circles.
