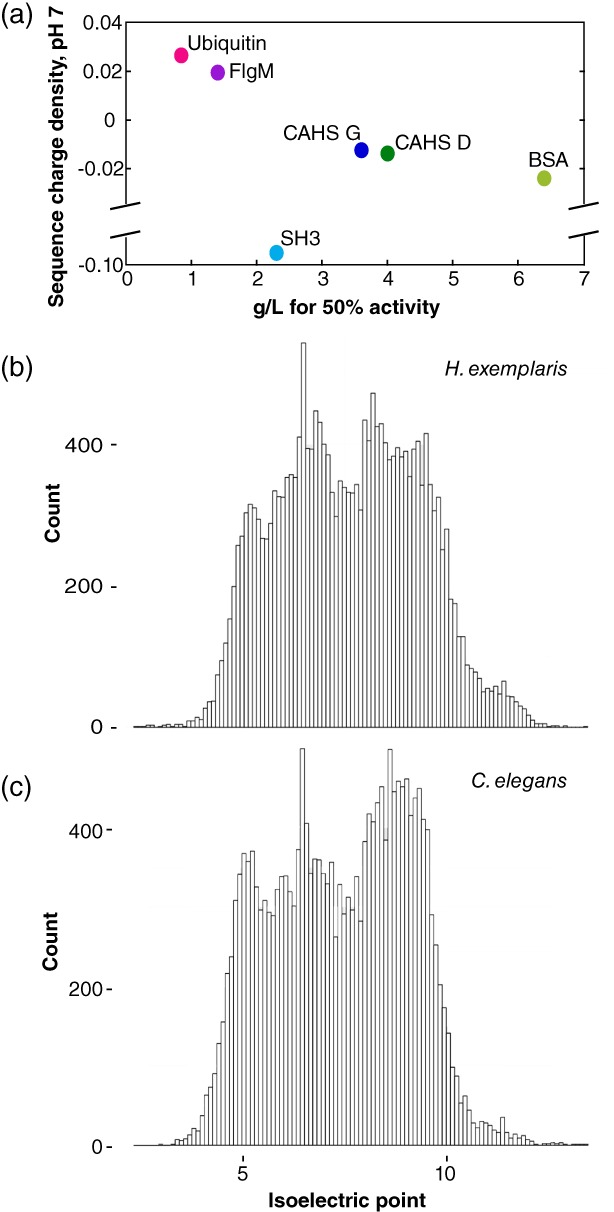
Figure 8.

(a) Charge at pH 7 divided by the number of residues in each protein plotted against the concentration for 50% protection of LDH activity. (b) Histogram of pI values at 0.1 intervals for predicted open reading frames in the genome of Hypsibius exemplaris.44, 45 (c) Histogram of pI values at 0.1 intervals for predicted open reading frames in the genome of Caenorhabditis elegans.46, 47
