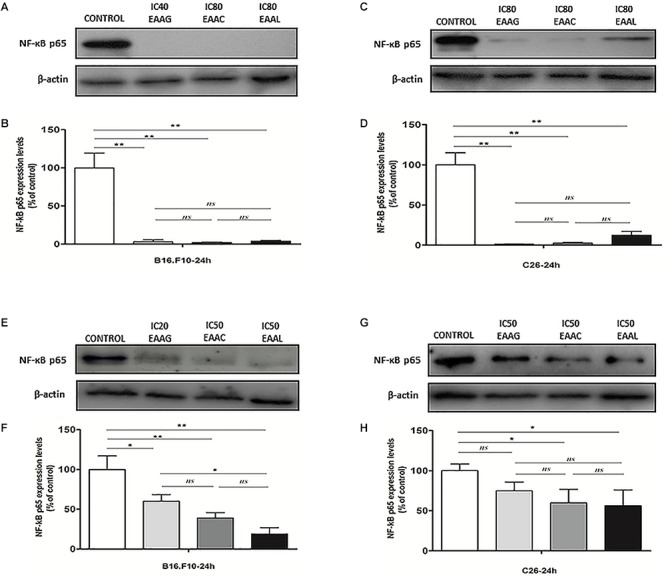
Figure 6.

The expression of NF-κB-p65 in cell lysates after different treatments. Western blot analysis of total NF-κB-p65 expression in cell lysates from (A,E) B16.F10 cells and (C,G) C26 cells after different treatments; β-actin was used as loading control. (B) % of NF-κB-p65 expression relative to control in B16.F10 melanoma cells after IC40 EEAG, IC80 EEAC, and IC80 EEAL treatments. (F) % of NF-κB-p65 expression relative to control in B16.F10 melanoma cells after IC20 EEAG, IC50 EEAC, and IC50 EEAL treatments. (D) % of NF-κB expression relative to control in C26 colon carcinoma cells after IC80 EEAG, IC80 EEAC, and IC80 EEAL treatments. (H) % of NF-κB expression relative to control in C26 colon carcinoma cells after IC50 EEAG, IC50 EEAC, and IC50 EEAL treatments. On B16.F10 cells: Control, untreated cells; IC40 or IC20 EEAG, cells incubated with 650 μg/mL or 260 μg/mL A. genevensis ethanolic extract; IC80 or IC50 EEAC, cells incubated with 650 μg/mL or 406.7 μg/mL A. chamaepitys ethanolic extract; IC80 or IC50 EEAL, cells incubated with 325 μg/mL or 236.8 μg/mL A. laxmannii ethanolic extract. On C26 cells: Control, untreated cells; IC80 or IC50 EEAG, cells incubated with 650 μg/mL or 457.5 μg/mL A. genevensis ethanolic extract; IC80 or IC50 EEAC, cells incubated with 650 μg/mL or 303 μg/mL A. chamaepitys ethanolic extract; IC80 or IC50 EEAL, cells incubated with 325 μg/mL or 176.3 μg/mL A. laxmannii ethanolic extract. Results represent the mean ± SD of two independent measurements. One way ANOVA test with Bonferroni correction for multiple comparisons was used to analyze the effects of different treatments on the levels of NF-κB-p65 in comparison with the pro-inflammatory transcription factor production in control (ns, P > 0.05; ∗P < 0.05;∗∗P < 0.01).
