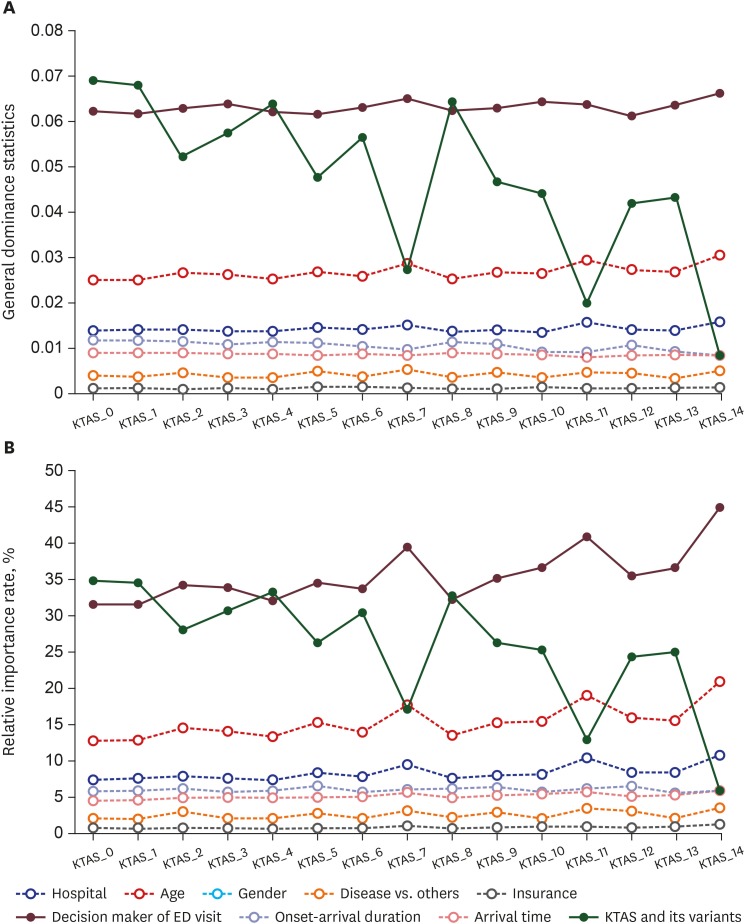
Fig. 3. General dominance and relative importance in various models with the KTAS and its variants. (A, B) General dominance statistics and relative importance rates for each variable in various models, which were constructed with covariates and the KTAS original and its variants. (A) The values of all covariates show a constant pattern regardless of the type of model; however, the KTAS was vulnerable to changes in the type of model (P < 0.001). (B) The values of the KTAS show the same pattern as (A), but the other variables show corresponding values as the number of the KTAS model increases (P < 0.001).
KTAS = Korean Triage and Acuity Scale, ED = emergency department.

