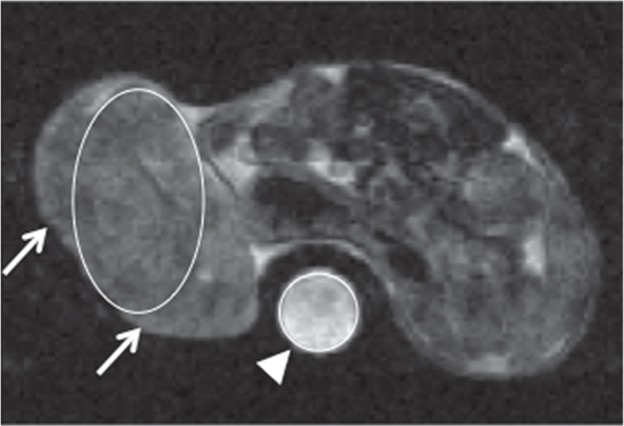
Fig. 3.

T2-weighted Pre-MRI at 2 h after treatment with anti-tumor drugs. For signal intensity (SI) measurement on pre- and post-MRI, as large round or oval ROI as possible was placed in a tumor (arrows) and a phantom (water) (arrowhead) on each of 5 slices scanned. Tumor SI was normalized with SI of a phantom. An average value of 5 normalized tumor SIs was used for evaluation.
