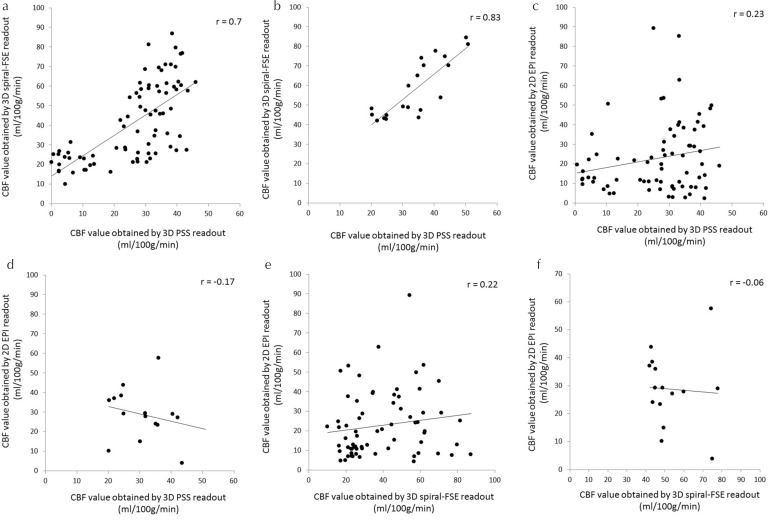
Fig. 5.
Scatterplot of the CBF values between two different readout methods. Scatterplot graph of CBF values between 3D-PSS and 3D spiral readouts in the cerebrum (a) and cerebellum (b); between 3D-PSS and 2D-EPI readouts in the cerebrum (c) and cerebellum (d) and between 3D spiral and 2D-EPI readouts in the cerebrum (e) and cerebellum (f). Correlation coefficients were particularly high in the comparison of 3D-PSS and 3D spiral readouts. CBF, cerebral blood flow; EPI, echo planar imaging; FSE, fast-spin echo; PSS, pseudo-steady state.

