
Fig 7.
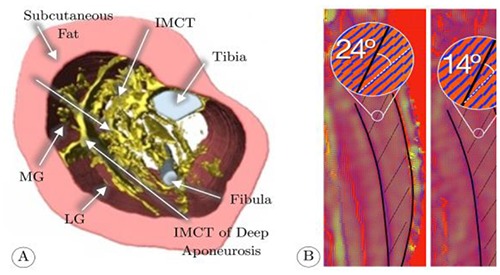
A; First ever 3D visualization (yellow) of the Intramuscular Connective Tissue network acquired with innovative UTE imaging. B; Principal component of the Strain rate tensor (SRT). Inset shows angle in Young (240 left) and Old (140 right) between fiber direction (black) and Principal component of SRT (blue). Larger angles may imply larger contributions from lateral compared to longitudinal force transmission (along muscle fiber direction).