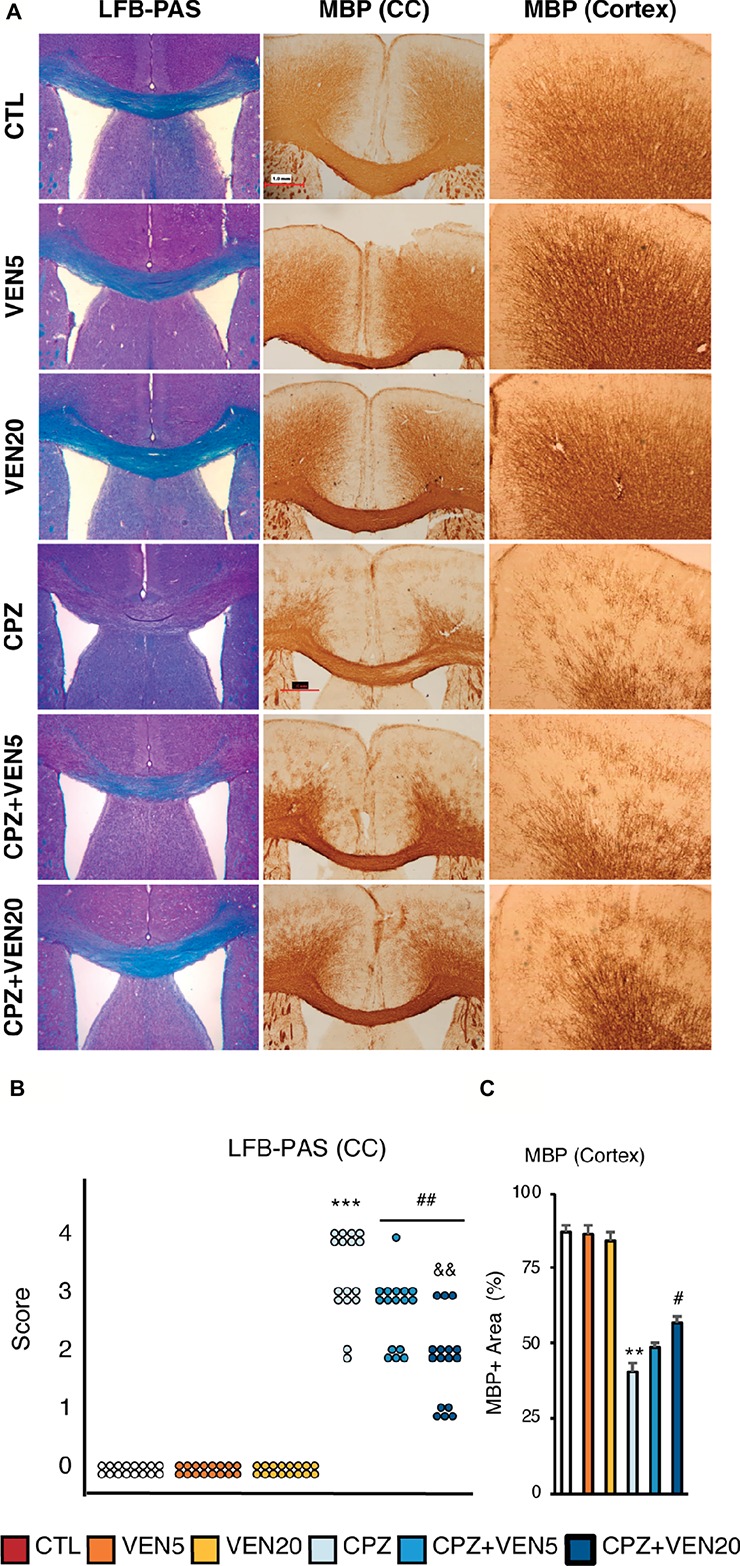
Figure 2.

The effects of venlafaxine on myelin integrity in normal and demyelinated mice. (A) Representative images of Luxol fast blue and periodic acid-Schiff (LFB-PAS) staining in the corpus callosum (CC) and myelin basic protein (MBP) immunostaining in the CC and cortex; (B) demyelination score based on LFB-PAS staining in the CC; (C) Quantitative analysis of cortical demyelination measured by percentage of MBP immunostaining area in the frontal cortex in each group. Data are presented as mean ± SEM (n = 16 mice per group). The LFB-PAS score was analyzed by the Kruskal-Wallis test (Dunn’s multiple comparison test). MBP staining data were analyzed by two-way ANOVA followed by Bonferroni post hoc analyses. Significances among different conditions are indicated as below: **p < 0.01 or ***p < 0.001 compared to the CTL; #p < 0.05 or ##p < 0.01 compared to CPZ. &&p < 0.01 compared to CPZ + VEN5. Scale bar represents 100 μm; CTL, control; CPZ, cuprizone; VEN5, venlafaxine 5 mg/kg/day; VEN20, venlafaxine 20 mg/kg/day.
