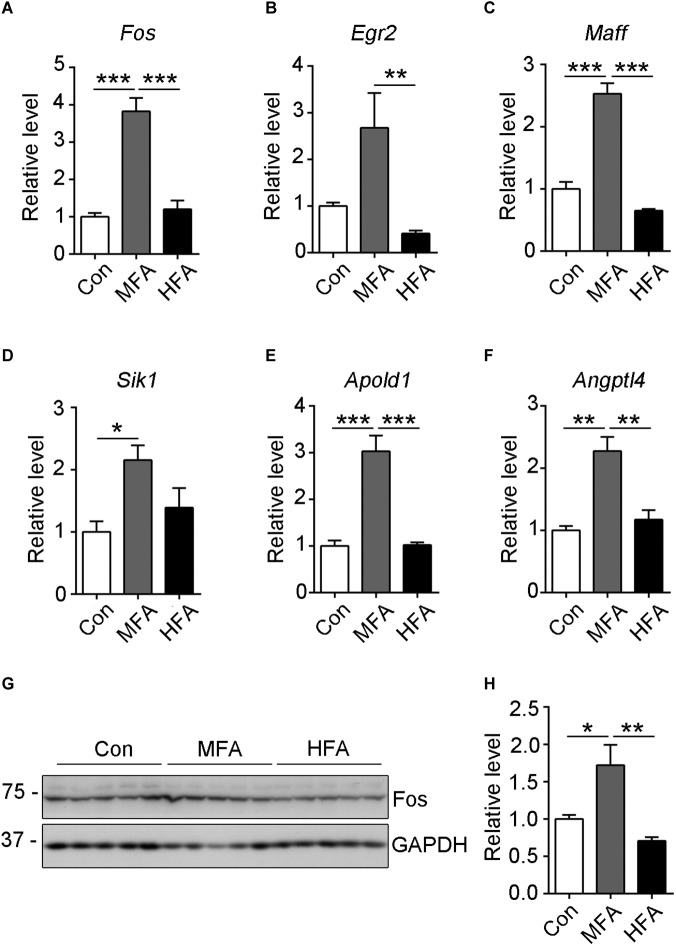
FIGURE 5.
Expression of selected differentially expressed genes as validated by qRT-PCR or western blot. (A–F) The relative mRNA expression level of Fos (A), Egr2 (B), Maff (C), Sik1 (D), Apold1 (E) and Angptl4 (F) genes were determined by qRT-PCR (n = 4). GAPDH was used for normalization. (G) The c-Fos protein level was analyzed by western blots. (H) The relative protein level of c-Fos was calculated after normalizing to GAPDH (n = 5). ∗p < 0.05, ∗∗ p < 0.01, ∗∗∗p < 0.001.

