
Figure 8.
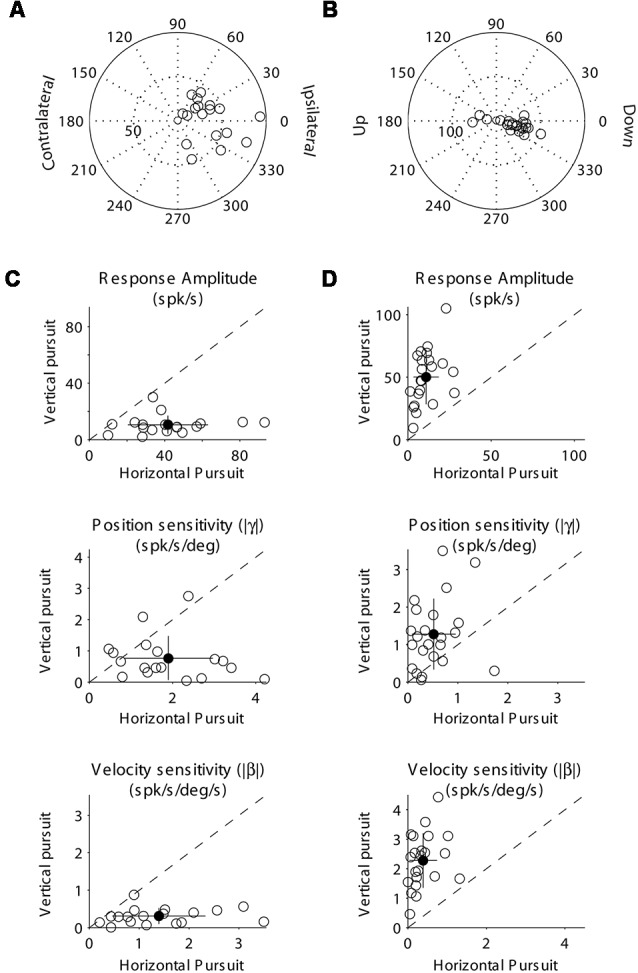
Population data showing the response modulation and neuronal sensitivity to eye movements of horizontal (A,C) and vertical (B,C) PCs. The layout is identical to that shown for Figure 4. (A) Polar plot showing the gain and phase of individual horizontal PCs with respect to eye velocity during sinusoidal horizontal pursuit. Panel (B) same as (A) but for vertical PCs during vertical sinusoidal pursuit. Panel (C) top, amplitude of neuronal modulation during horizontal vs. vertical sinusoidal pursuit. Middle, neuronal eye position sensitivity (absolute values) calculated during horizontal vs. vertical sinusoidal pursuit. Bottom, neuronal eye velocity sensitivity (absolute values) calculated during horizontal vs. vertical sinusoidal pursuit. Panel (D) same as (C) but for vertical PCs. Filled symbols in (C) and (D) show the average values, and the lines segments on top of them plus/minus one standard deviation from the mean.