Figure 2.

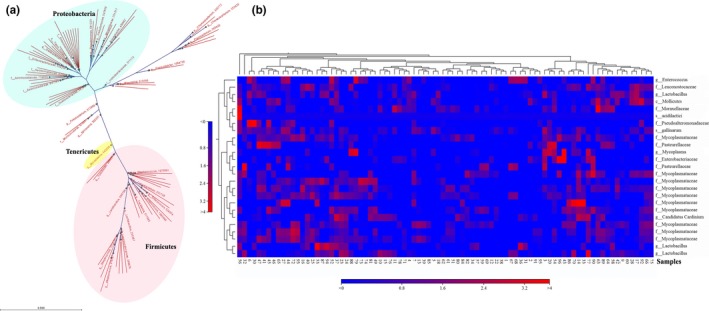
Dendrograms of phylogenic analysis and heat map of the relative abundance for representative family or genus in OTUs. (a) Phylogenic analysis of OTUs. (b) The heat map of the relative abundance for representative family or genus in OTUs

Dendrograms of phylogenic analysis and heat map of the relative abundance for representative family or genus in OTUs. (a) Phylogenic analysis of OTUs. (b) The heat map of the relative abundance for representative family or genus in OTUs