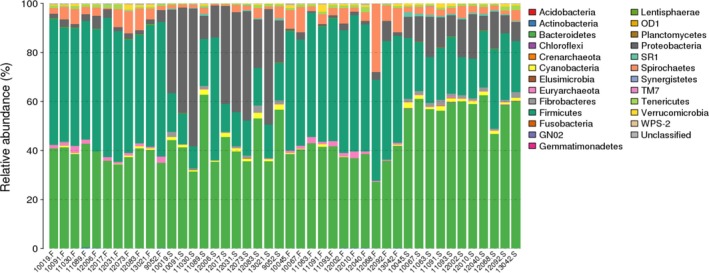
Figure 2.

The taxonomic composition distribution in rumen fluid and fecal samples at the phylum level. Note. Abscissa represent samples of rumen fluid or feces and each serial number represent a different cow. S represents rumen fluid samples. F represents fecal samples. The vertical axis represent relative abundance of each phylum
