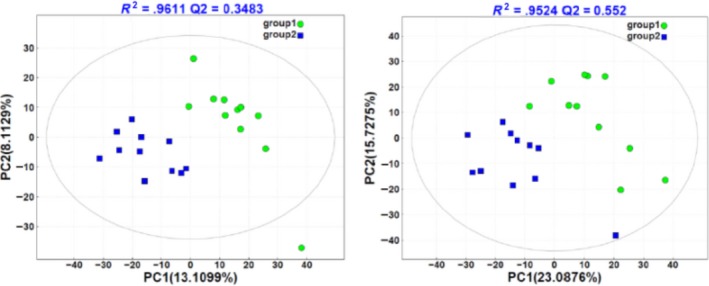
Figure 7.

PLS‐DA score plot of rumen metabolites between groups. Note. The abscissa represents the first principal component PC1, the ordinate represents the second principal component PC2, and the model parameter R2 is above the graph. Each point in the plot corresponds to an observation. The groups are shown in different colors. Group 1 represents high‐production cows. Group 2 represents low‐production cows
