Figure 8.

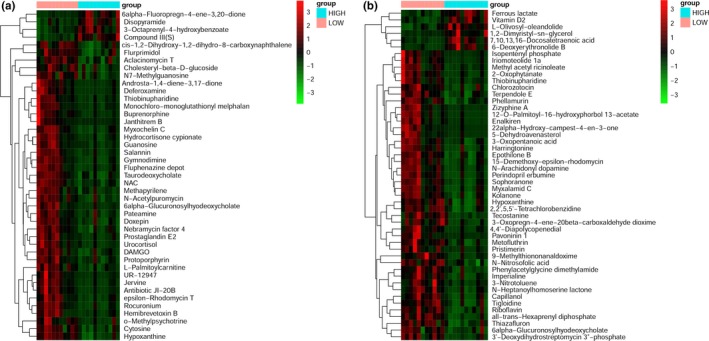
(a) Heat map analysis of significant differences in abundance of metabolites in negative ion mode. (b) Heat map analysis of significant differences in abundance of metabolites in positive ion mode

(a) Heat map analysis of significant differences in abundance of metabolites in negative ion mode. (b) Heat map analysis of significant differences in abundance of metabolites in positive ion mode