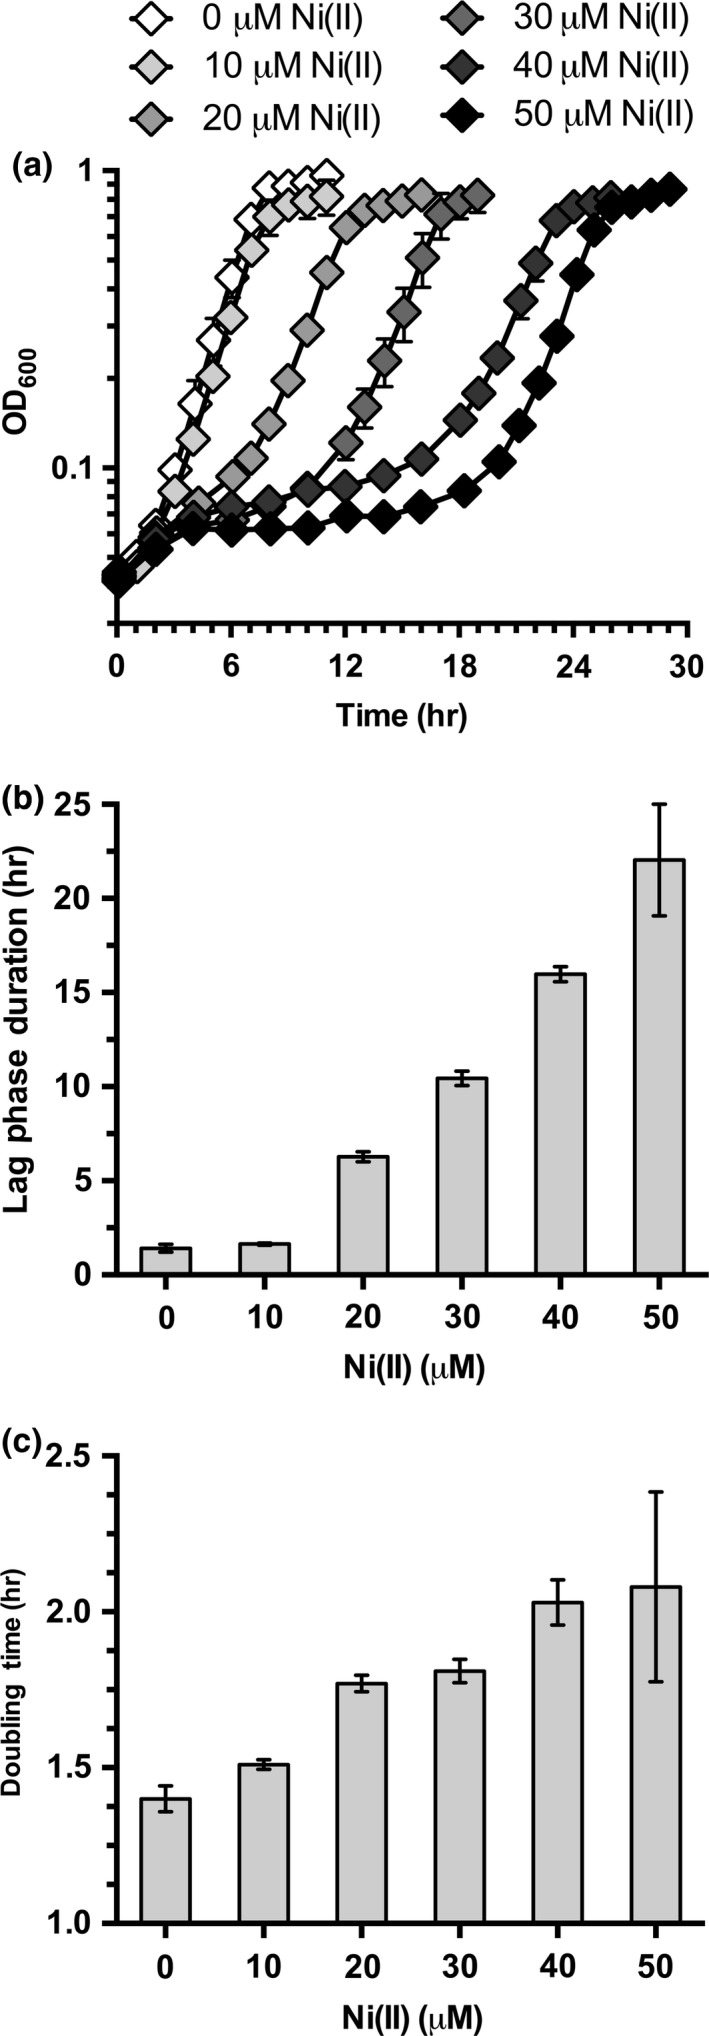
Figure 1.

Nickel exposure extends lag phase duration. (a) Growth curves of wild type MG1655 Escherichia coli cells in M9 gluconate minimal media exposed to 0 μM, 10 μM, 20 μM, 30 μM, 40 μM, or 50 μM nickel chloride. (b) Lag phase duration calculated from the growth curve data shown in (a). (c) Doubling times calculated from the growth curve data shown in (a). All growths were repeated in triplicate (n = 3) and error bars indicate one standard deviation from the mean value
