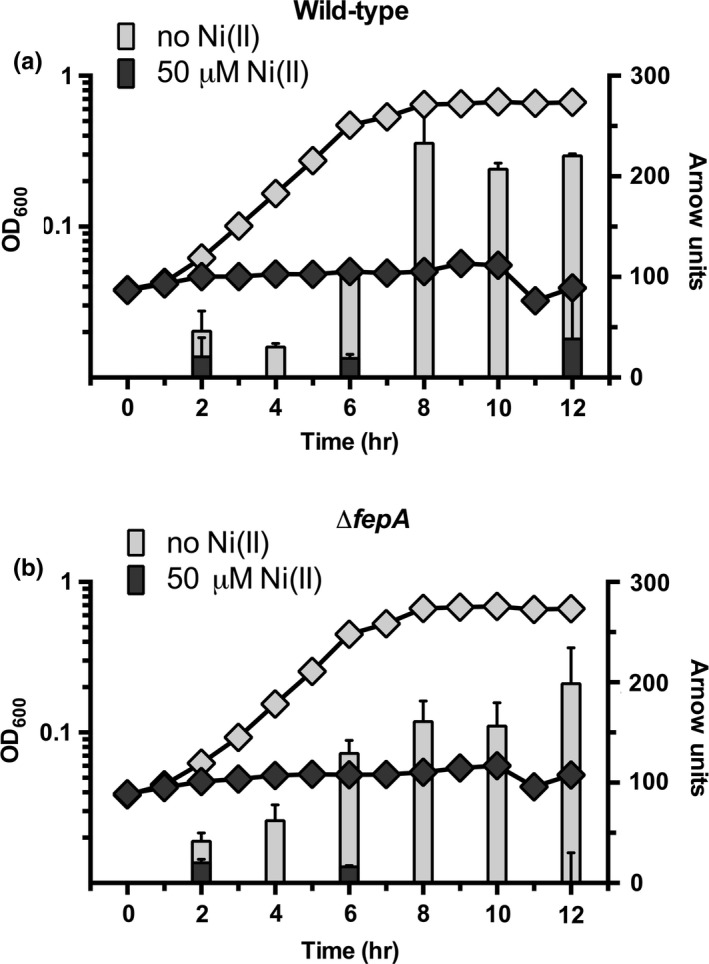
Figure 4.

Nickel decreases levels of extracellular catecholate siderophores during lag phase. Total catecholate production is expressed in Arnow units (right axis, bars). Relative growth is expressed by optical density at 600 nm (left axis, diamonds). (a) Wild‐type and (b) ΔfepA MG1655 E. coli cells measurements are overlaid with growth data from the same cultures (left axis, diamonds). All growths were repeated in triplicate (n = 3) and error bars indicate one standard deviation from the mean value
