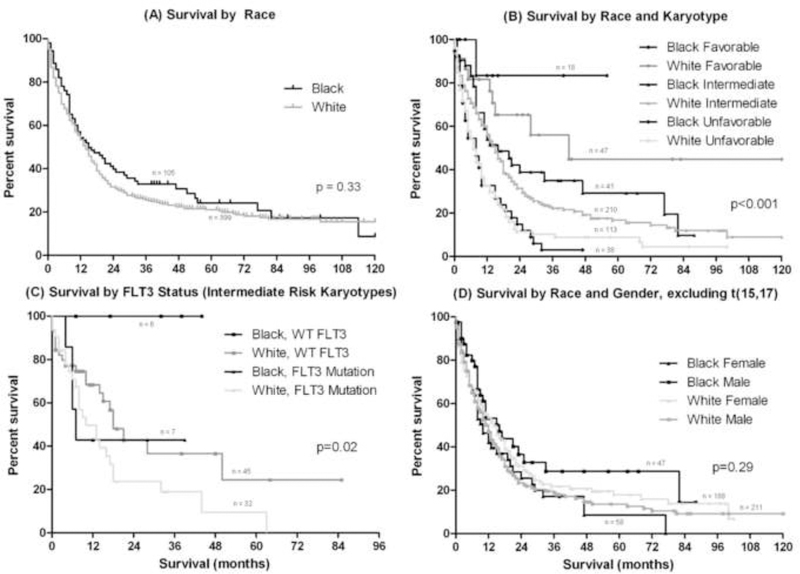
Figure 1 –
OS in (A) blacks vs. whites, (B) blacks vs. whites stratified by karyotype; comparisons of black and white patients within individual cytogenetic groups were not statistically significant and are detailed in Table 3, (C) blacks vs. whites with intermediate-risk karyotypes stratified by FLT3 status; FLT3 wild-type (WT) was a significant predictor of longer OS in black patients (p=0.03), but was of only borderline significance in whites (p=0.07), and (D) blacks vs. whites stratified by race and gender.

