
Figure 2. IF was associated with decreased leptin and increased adiponectin, corticosterone and β-hydroxybutyrate.
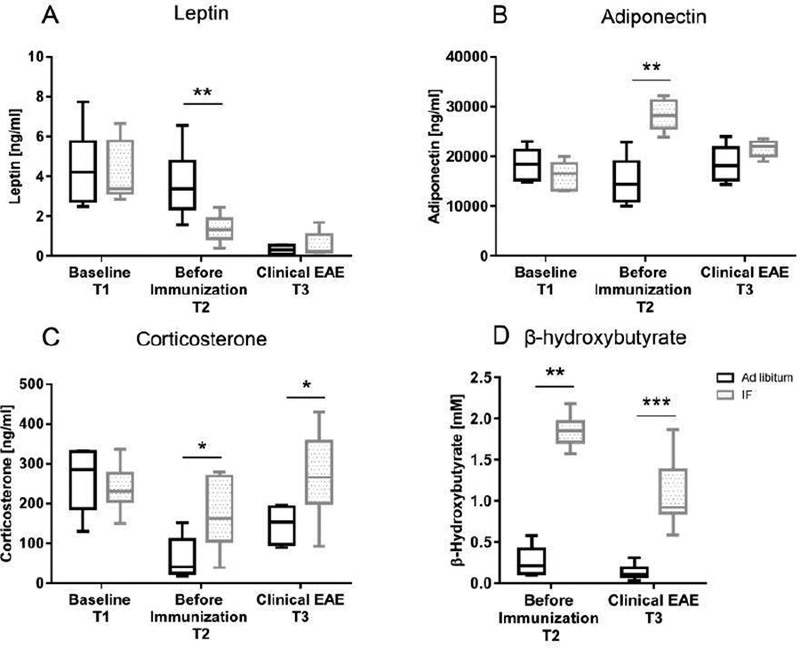
Serum levels of (A) leptin (n=6/group), (B) adiponectin (n=5/group), (C) corticosterone (n=6/group) and (D) β-hydroxybutyrate (n=10/group) were measured by ELISA at different time points during the experiment: baseline before starting the diet (IF or ad libitum feeding-T1), after 4 weeks on the diet but before immunization (T2), during clinical EAE (day 18–20 post-immunization-T3). The box in the graphs extends from the 25th to 75th % percentiles, the bars are median, the whiskers indicate the smallest and largest values. Measurements for leptin, adiponectin and corticosterone were performed in 3 different experiments with similar results (Table S2 reports the results of all experiments performed); β−hydroxybutyrate was measured in 2 different experiments with similar results. In the ELISA assays each sample was run in duplicate. * P<0.05; ** P<0.005, *** P<0.0005. All P values were calculated by Mann-Whitney test.