
Figure 7. Changes of blood metabolites and the gut microbiome after 15 days of IF in RRMS patients.
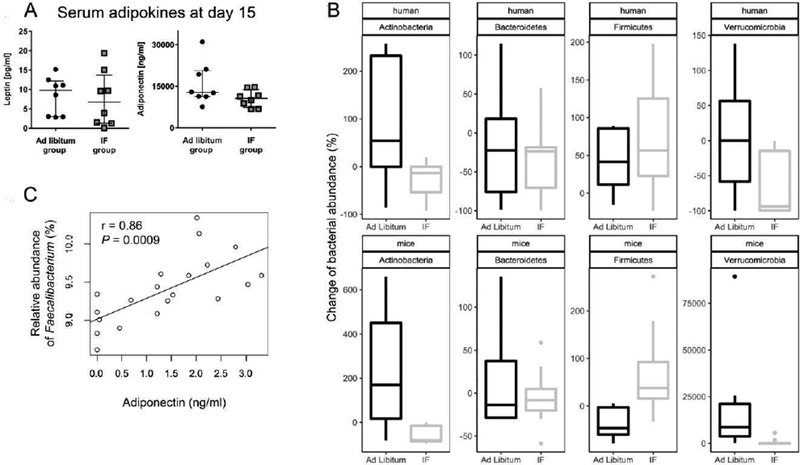
(A) Comparison of serum levels of leptin and adiponectin on day 15 in RRMS patients in the IF and ad libitum groups in the human trial. (B) At phylum level, the alteration of the gut microbiome after IF for 15 days in RRMS patients (n=5 patients/group, top panel) shows similar trends as that in mice (n=8 mice/group, bottom panel). Y-axis represents the percentage of change of the relative abundance of the gut microbiome. In human studies, the percentage change is calculated based on the microbial abundance at baseline and day 15. In mouse studies, the percent change is calculated based on the microbial abundance on T2 and T3. (c) Levels of serum adiponectin are strongly positively correlated with the relative abundance of Faecalibacterium in the MS study participants (r=0.86, P=0.009 Pearson correlation).