
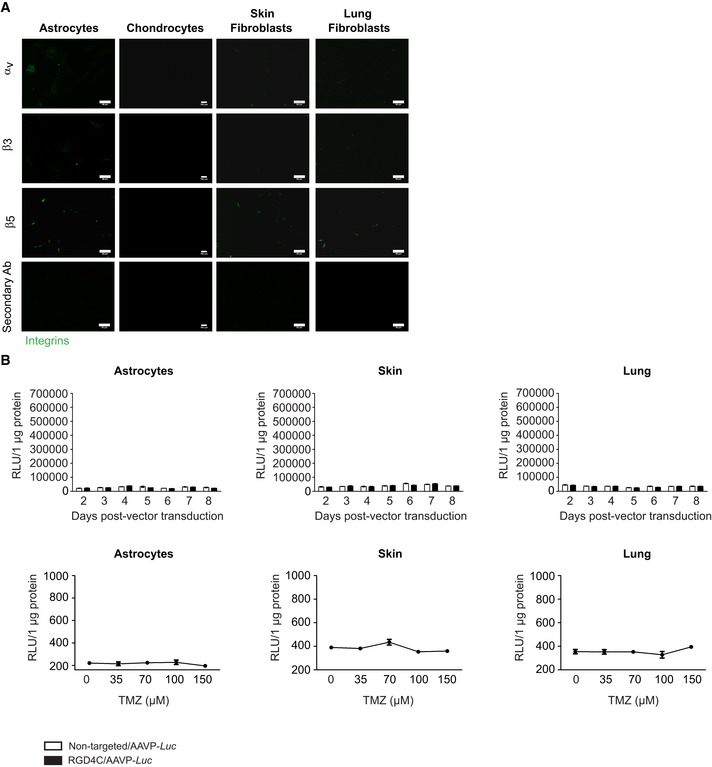
Figure 7. Integrin expression in human primary normal cells and then analysis of targeted gene delivery.
-
AImmunofluorescent staining for αv, β3, or β5 integrins in human normal astrocytes, chondrocytes, skin, and lung fibroblasts. Scale bars, 160 μm for chondrocytes and 80 μm for all other cells.
-
BTreatment of human primary normal cells with RGD4C/AAVP‐Luc vector, alone or in the presence of TMZ. Non‐targeted/AAVP‐Luc was used as negative control. Results represent RLU/1 μg protein. Data shown are representative of two experiments, n = 3.