-
A
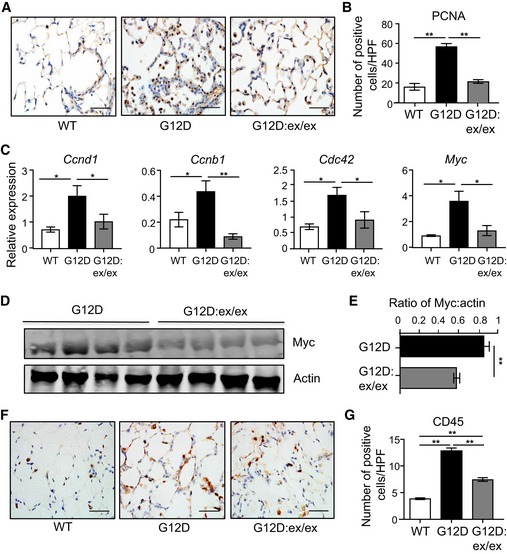
Representative images of PCNA‐stained lung sections from Kras
WT, Kras
G12D, and Kras
G12D:Adam17
ex/ex mice at 6 weeks post‐Ad‐Cre (for Kras
G12D) or vehicle (for Kras
WT) inhalation. Scale bar, 100 μm.
-
B
Quantification of PCNA‐positive cells/high‐power field (HPF) in the indicated mouse lungs (n = 6 per genotype). **P < 0.01, Student's t‐test, mean ± SEM.
-
C
qPCR expression analyses of cell cycle regulation genes (normalized against 18SrRNA) in lungs from the indicated mice (n = 6 per genotype). *P < 0.05, Student's t‐test, mean ± SEM.
-
D
Representative immunoblots of Kras
G12D and Kras
G12D:Adam17
ex/ex lung lysates with the indicated antibodies. Each lane is an individual mouse sample.
-
E
Semi‐quantitative densitometry of Myc protein levels (relative to actin) in lung lysates from (D). n = 6 per genotype. **P < 0.01, Student's t‐test, mean ± SEM.
-
F, G
Representative images (F) and quantification of CD45‐positive cells/HPF (G) in CD45‐stained lung sections from the indicated genotypes at 6 weeks post‐inhalations, mean ± SEM. In (F), scale bar, 100 μm. In (G), n = 6 per genotype. **P < 0.01, Student's t‐test.
.

