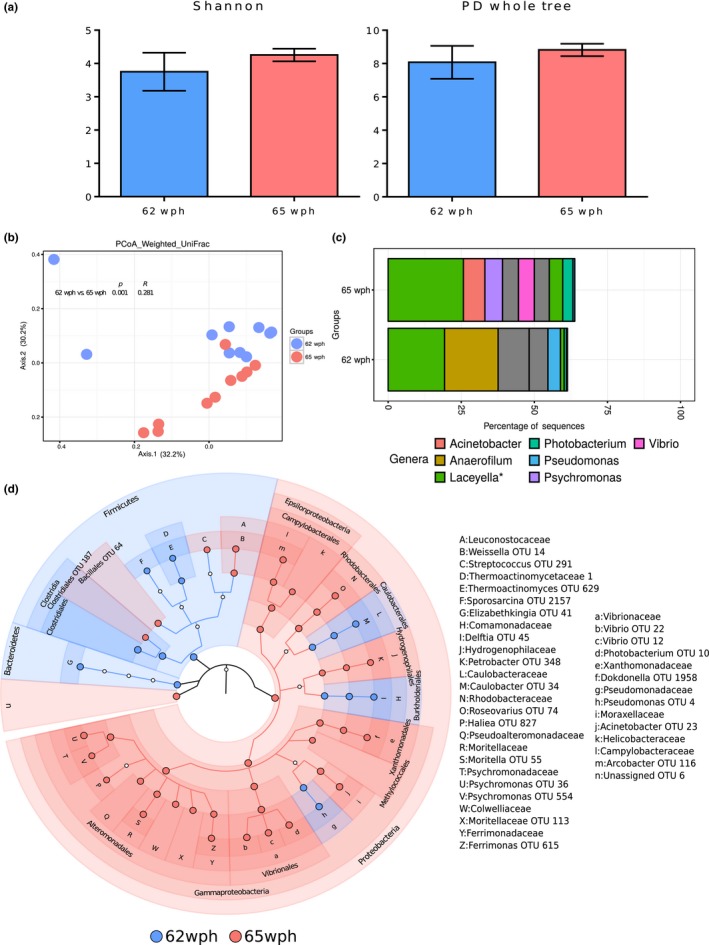
Figure 6.

Plots showing the comparison between stages 62wph—freshwater and 65wph—seawater. A stage‐specific color coding is used for figures a, b, and d. (a) Alpha diversity indices (Shannon index, PD whole tree) of the bacterial communities and (b) Weighted UniFrac distances‐based PCoA. (c) Mean relative abundance of the 10 most abundant OTUs, plotted at the genus level. The OTUs are colored according to their taxonomic classification, and the OTUs without any assignment are shown in gray. (d) Cladogram showing the significantly abundant taxonomic groups in each of the stages, identified based on the LEfSe analysis (p < 0.05 and effect size >3.5).
