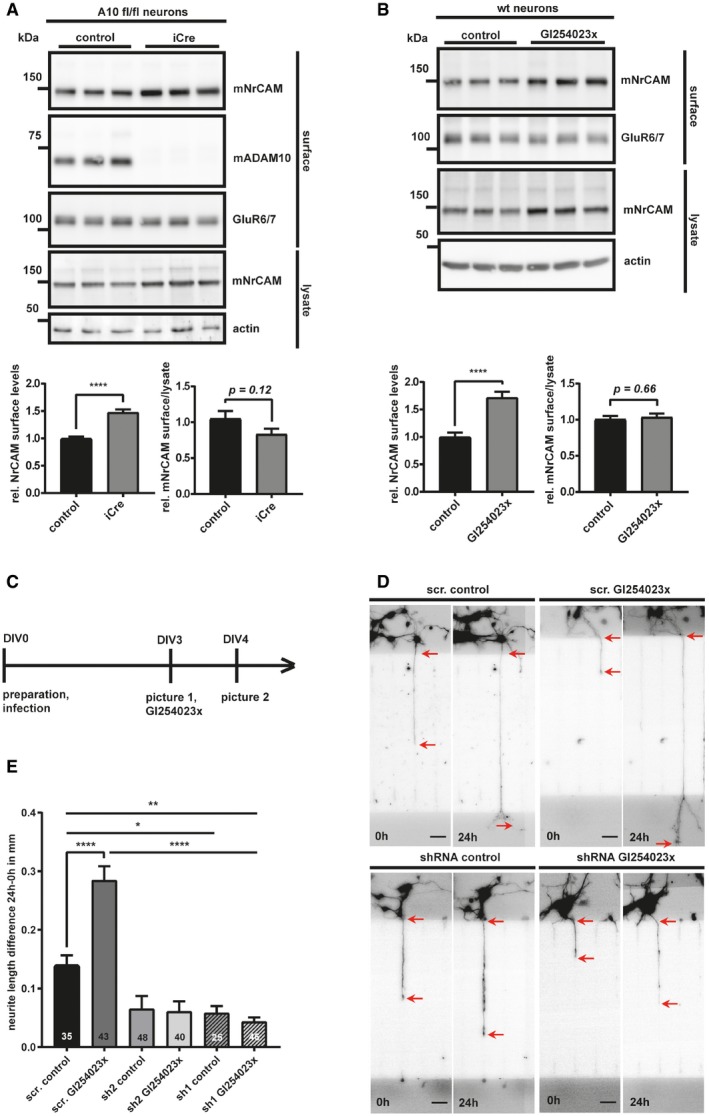
Figure 3. ADAM10 is controlling surface expression of NrCAM and NrCAM‐mediated neurite outgrowth.

-
AADAM10fl/fl neurons were treated with an iCre (to induce an ADAM10 KO), or a control lentivirus at DIV2. At DIV7, cell surface proteins were labeled with biotin and enriched by streptavidin pull‐down. The biotinylated proteins were detected by immunoblotting. Total lysates were analyzed to compare mNrCAM's surface/lysate levels. Densitometric quantifications of the Western blots are shown. Two‐sided Student's t‐test (****P < 0.0001, n = 7). Given are mean ± the standard error of the mean. The mean levels of solvent‐treated cells were set to 1.
-
BPrimary murine neurons were treated with GI254023x (5 μM) or solvent, for 48 h. The cell surface proteins were enriched like in (A). Densitometric quantifications of the Western blots are shown. Two‐sided Student's t‐test (****P < 0.0001, n = 11). Given are mean ± the standard error of the mean. The mean levels of solvent‐treated cells were set to 1. Representative Western blots are shown.
-
CWorkflow of the neurite outgrowth assay.
-
DRepresentative pictures of single neurites at timepoint 0 h (DIV3) and 24 h (DIV4). Neurons were infected 4 h after plating with lentiviruses encoding GFP (to visualize the neurons) together with shRNA expression cassettes (sh1 and sh2) targeting either NrCAM or carrying a scrambled (scr) control construct. Images of neurites were taken at 3 days in vitro (DIV3) and 24 h later at DIV4. In order to study the effect of ADAM10 on neurite outgrowth, neurons were treated with the ADAM10 inhibitor GI254023x, or vehicle (control), at DIV3, after taking the first pictures with an epifluorescent microscope. The differences in neurite length were calculated as absolute values (neurite length at 24 h minus neurite length of 0 h) for individual neurites passing through the middle channels of the chambers. Only neurites that had already entered the main channel at 0 h and had not yet left those channels at 0 h were considered. The red arrows indicate the start and the end of the respective length measurements. The scale bar indicates 40 μm.
-
EQuantification and statistical analysis of the neurite outgrowth assay shown in (D). Scr. = scrambled; sh 1 and 2 = shRNA1 and 2. One‐way ANOVA with post hoc Dunnett's test. Given are mean ± the standard error of the mean (*P < 0.05; **P < 0.01; ****P < 0.0001, n‐numbers for each condition are shown in the graph).
Source data are available online for this figure.
