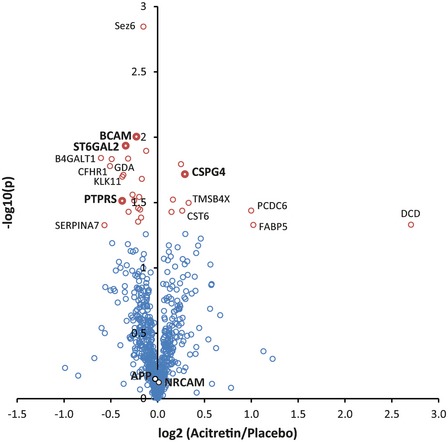
Figure 6. Mass spectrometric analysis of acitretin CSF samples.

Volcano plot of the proteomic analysis of CSF from AD patients treated with acitretin or placebo for 30 days. Every circle represents one protein. The log10‐transformed t‐test P‐values (again treatment/baseline for every patient) are plotted against the log2‐transformed label‐free quantification intensity ratios of acitretin and placebo CSF. Proteins with a P‐value of less than 0.05 are labeled in red. Proteins that are additionally changed by more than 20% compared to placebo are labeled with their names. ADAM10 substrates are indicated in bold writing. In total, more than 50 ADAM10 substrates were identified, but only the significantly altered substrates as well as NrCAM and APP are indicated.
