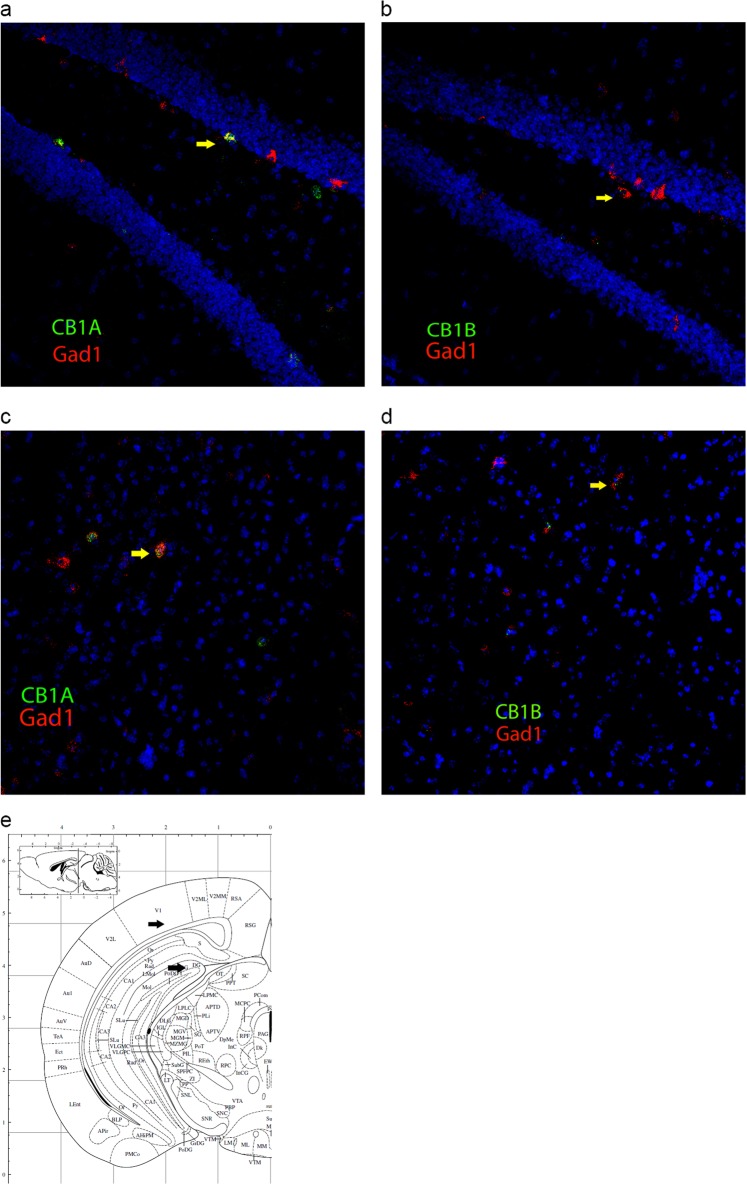
Fig. 4.
RNAscope ISH colocalization (20×) of mCB1A and mCB1B isoform-specific probes (green) with the GABAergic Gad1 (red) probe in hippocampus (a mCB1A; b mCB1b) and cortex (c mCB1A; d mCB1B). Yellow arrows indicate the colocalization of mCB1 isoforms with Gad1. Corresponding hippocampus and cortex stereotaxic coordinates are shown by black arrows (e)

