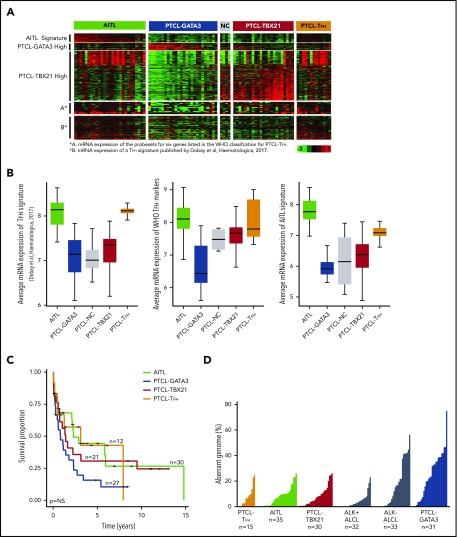
Figure 1.
Characteristics of PTCL entities and subgroups. (A) Gene expression data of predefined gene signatures for AITL, the PTCL-GATA3 and PTCL-TBX218 subgroups, and PTCL-TFH17 using fresh-frozen RNA on the HG-U133 Plus2 platform (Affymetrix). (B) Average expression of the PTCL-TFH signature17 in PTCL subgroups (left panel), the probe sets for 6 genes listed by the WHO to classify PTCL-TFH (middle panel), and the AITL molecular signature8 (right panel). (C) Kaplan-Meier curves comparing OS between the PTCL subgroups with available data. (D) Comparison of percent aberrant genome in PTCL subgroups (PTCL-TFH, AITL, PTCL-TBX21, ALK+ ALCL,20 ALK− ALCL,20 and PTCL-GATA3).

