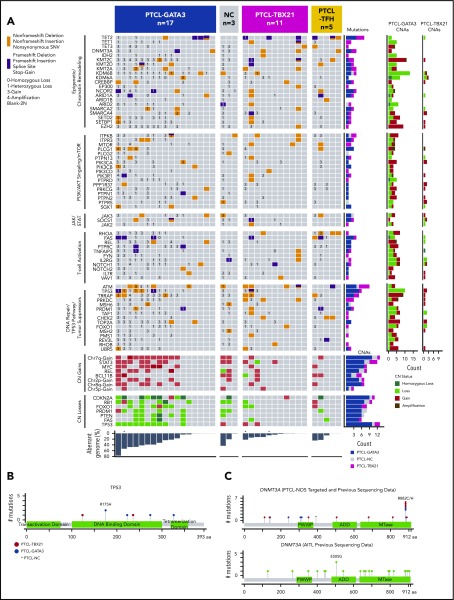
Figure 6.
Select CNAs or genes found to be recurrently mutated in molecular PTCL subgroups. (A) The block color represents the type of mutation. Blocks with 2 colors indicate that >1 type of mutation was observed in the case. CNA status of the mutated genes are noted (3 = copy gain, 4 = amplification, 1 = copy loss, 0 = homozygous copy loss). The bar graphs to the right of the plot indicate the number of cases with the denoted mutation or CNA. The total percent aberrant genome is indicated below the plot. *Denotes 3 cases that were only included for mutation analysis, and CN status was determined by CopywriteR.61 Schematic diagrams of the location of coding mutations identified in TP53 (B) and DNMT3A (C). The DNMT3A schematic diagram combines targeted sequencing results from this study with previous amplicon sequencing data.39 The figures were generated using MutationMapper.62 MTase, methyltransferase.

