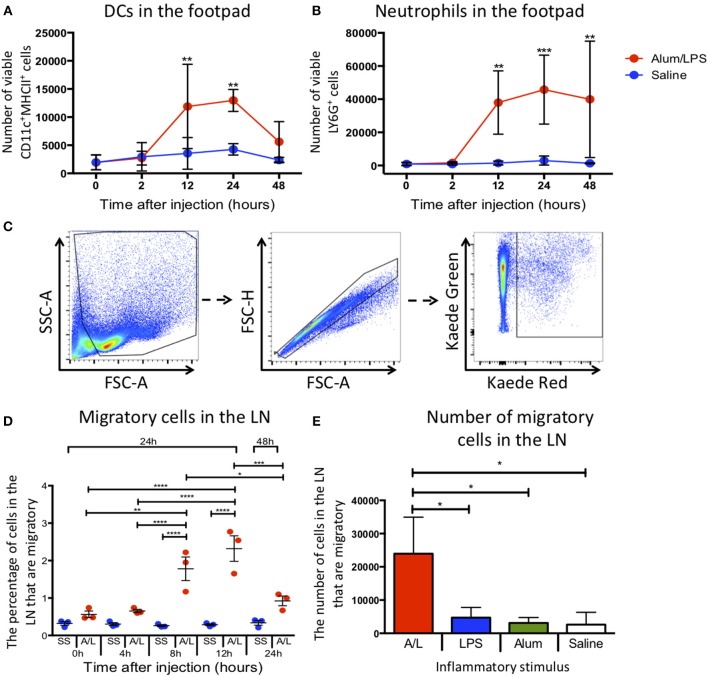
Figure 1.
Inflammation at the site of injection drives migration to the draining lymph node. C57BL/6 mice were injected with alum/LPS in the left hind footpad and saline in the right hind footpad and subsequently culled 0, 2, 12, 24, or 48 h later and the skin from the footpads analyzed by flow cytometry. (A) The total number of live CD11c+MHCII+ cells isolated from the footpad and (B) the total number of live Ly6G+MHCII− cells isolated from the footpad are shown. n = 4 ± 1 SD (**p < 0.01, ***p < 0.001). Kaede mice were injected with alum/LPS in the left hind footpad or saline in the right and the footpad was photo-converted at 0, 4, 8 or 12 h post injections. Mice were then culled 24 or 48 h after injection and the popliteal lymph node removed and analyzed by flow cytometry. (C) Migratory cells were identified by gating out debris using FSC and SSC, doublet exclusion using FSC-A and FSC-H followed by identifying migratory cells based on Kaede red expression. As we exposed the footpad to violet light only, any cells expressing Kaede red in the lymph node must have migrated there from the footpad. (D) The percentage of migratory cells entering the draining lymph node directly from the footpad is shown. n = 3 ±1 SD (*p < 0.05, **p < 0.01, ***p < 0.001, ****p < 0.0001). (E) the number of inflammatory cells identified in the draining lymph node of Kaede mice after challenge with alum alone, LPS alone or alum/LPS over a 24 h period is shown. n = 3 ± 1 SD (*p < 0.05).

