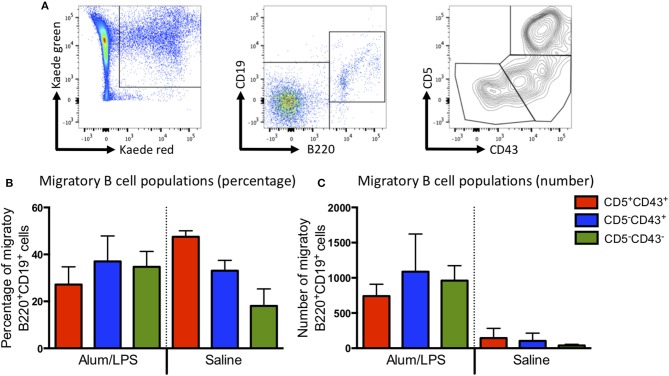
Figure 3.
B1a, B1b, and B2 cells can be identified in the migratory population. Kaede mice were injected with alum/LPS or saline in the hind footpad and photo-conversion was performed 12 h later. Mice were culled after a further 12 h and the popliteal lymph nodes analyzed by flow cytometry. (A) The gating strategy used to identify B cells from the migratory population is highlight. Migratory cells were first identified and B cells selected based on B220 and CD19 expression. B cells subsets were identified using CD5 and CD43. We show (B) The proportion and (C) numbers of each B cell subset. Data are representative of two independent experiments. n = 3 ±1 SD.

