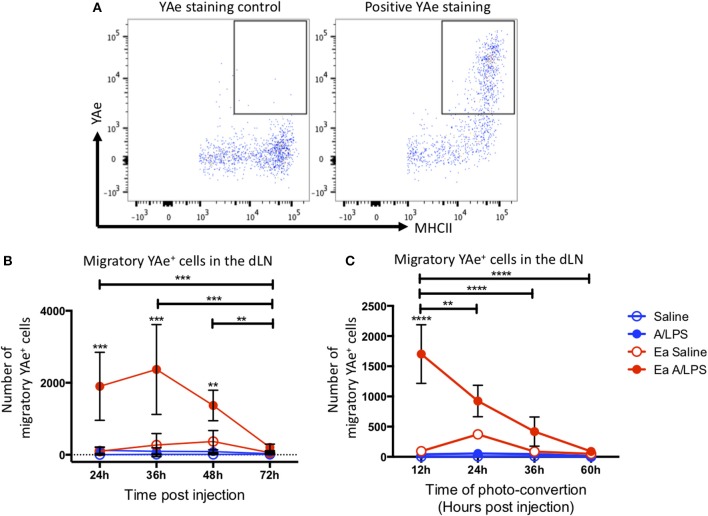
Figure 5.
The peak of antigen presentation occurs at 24–36 h post challenge. Mice were treated with alum/LPS/Eα or saline/Eα, photoswitched 12 h later then flow cytometry analysis of isolated LN was performed between 24 and 72 h post challenge. (A) The identification of YAe+ cells was performed using a YAe staining control using the YAe antibody in samples without the Eα peptide. Positive staining in shown for comparison. (B) The number of live migratory MHCII+ cells that present antigen (YAe+). Data are representative of two independent experiments. n = 4 ± 1 SD (**p < 0.01, ***p < 0.001). Mice were treated with alum and LPS or saline with or without the Eα-OVA construct and culled between 24 and 72 h post challenge with photo-conversion performed 12 h before the cull. (C) The number of live migratory MHCII+ cells that are presenting antigen (YAe+) is shown. n = 4 ±1 SD (**p < 0.01, ****p < 0.0001).

