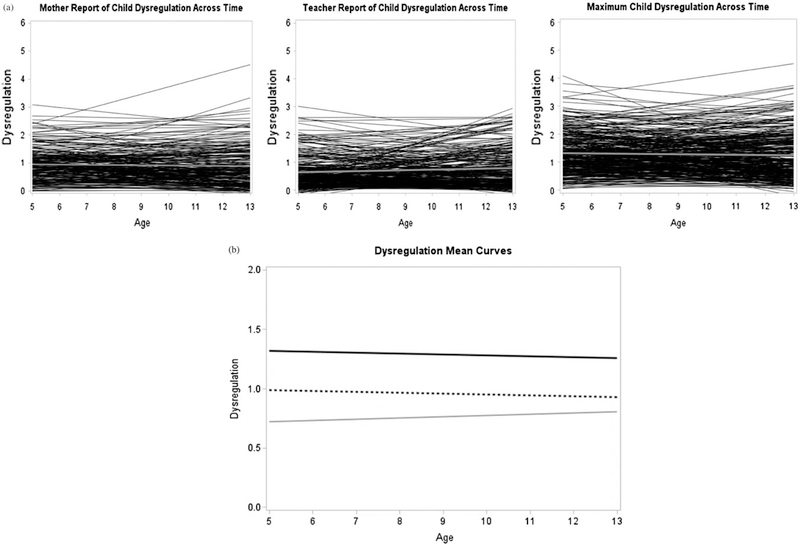
Figure 1.
Linear regression lines of mother, teacher, and maximum dysregulation scores and child age. (a) The black lines represent individual trajectories; overlaid gray lines represent the average trajectory for the whole sample. Linear trajectories are displayed, as this form of growth was used in all subsequent models. (b) The solid black line represents the mean linear curve for maximum score, the dashed black line represents the mean linear curve for mother-reported dysregulation, and the solid gray line represents the mean linear curve for teacher-reported dysregulation.

